2.4 Impact of 2022 drought on maize fields using remote sensing data
Written By Ali Naeini
Year 2022, was the year of widespread severe drought in Europe. In the Netherlands, 2022 was a dry year like 2018. The meteorological information obtained from the Netherlands Meteorological Organization (KNMI) as well as the processing of the data acquired by MODIS sensor from the NASA-TERRA satellite (spatial resolution of 250 meters) by the AgriWatch B.V. since 2000 clearly show the occurrence of drought in the years 2018 and 2022. Figure (1) shows the trend of changes in the NDVI index (greenness rate) in the whole Netherlands since 2015 (average of NDVI values for each 250*250 meter region over whole Netherlands and during each 16 days). The decrease in the values of this index in 2018 and 2022 is clearly visible.

Figure (1): Time Series MODIS-NDVI since January 2015 to August 2022 over whole Netherlands (every 16 days)
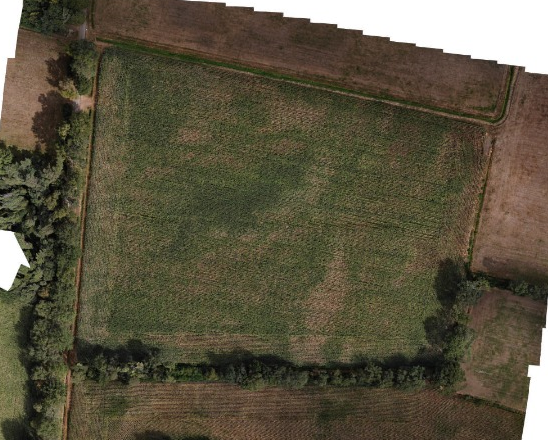
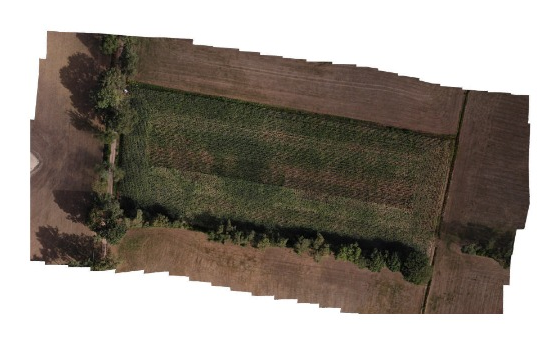
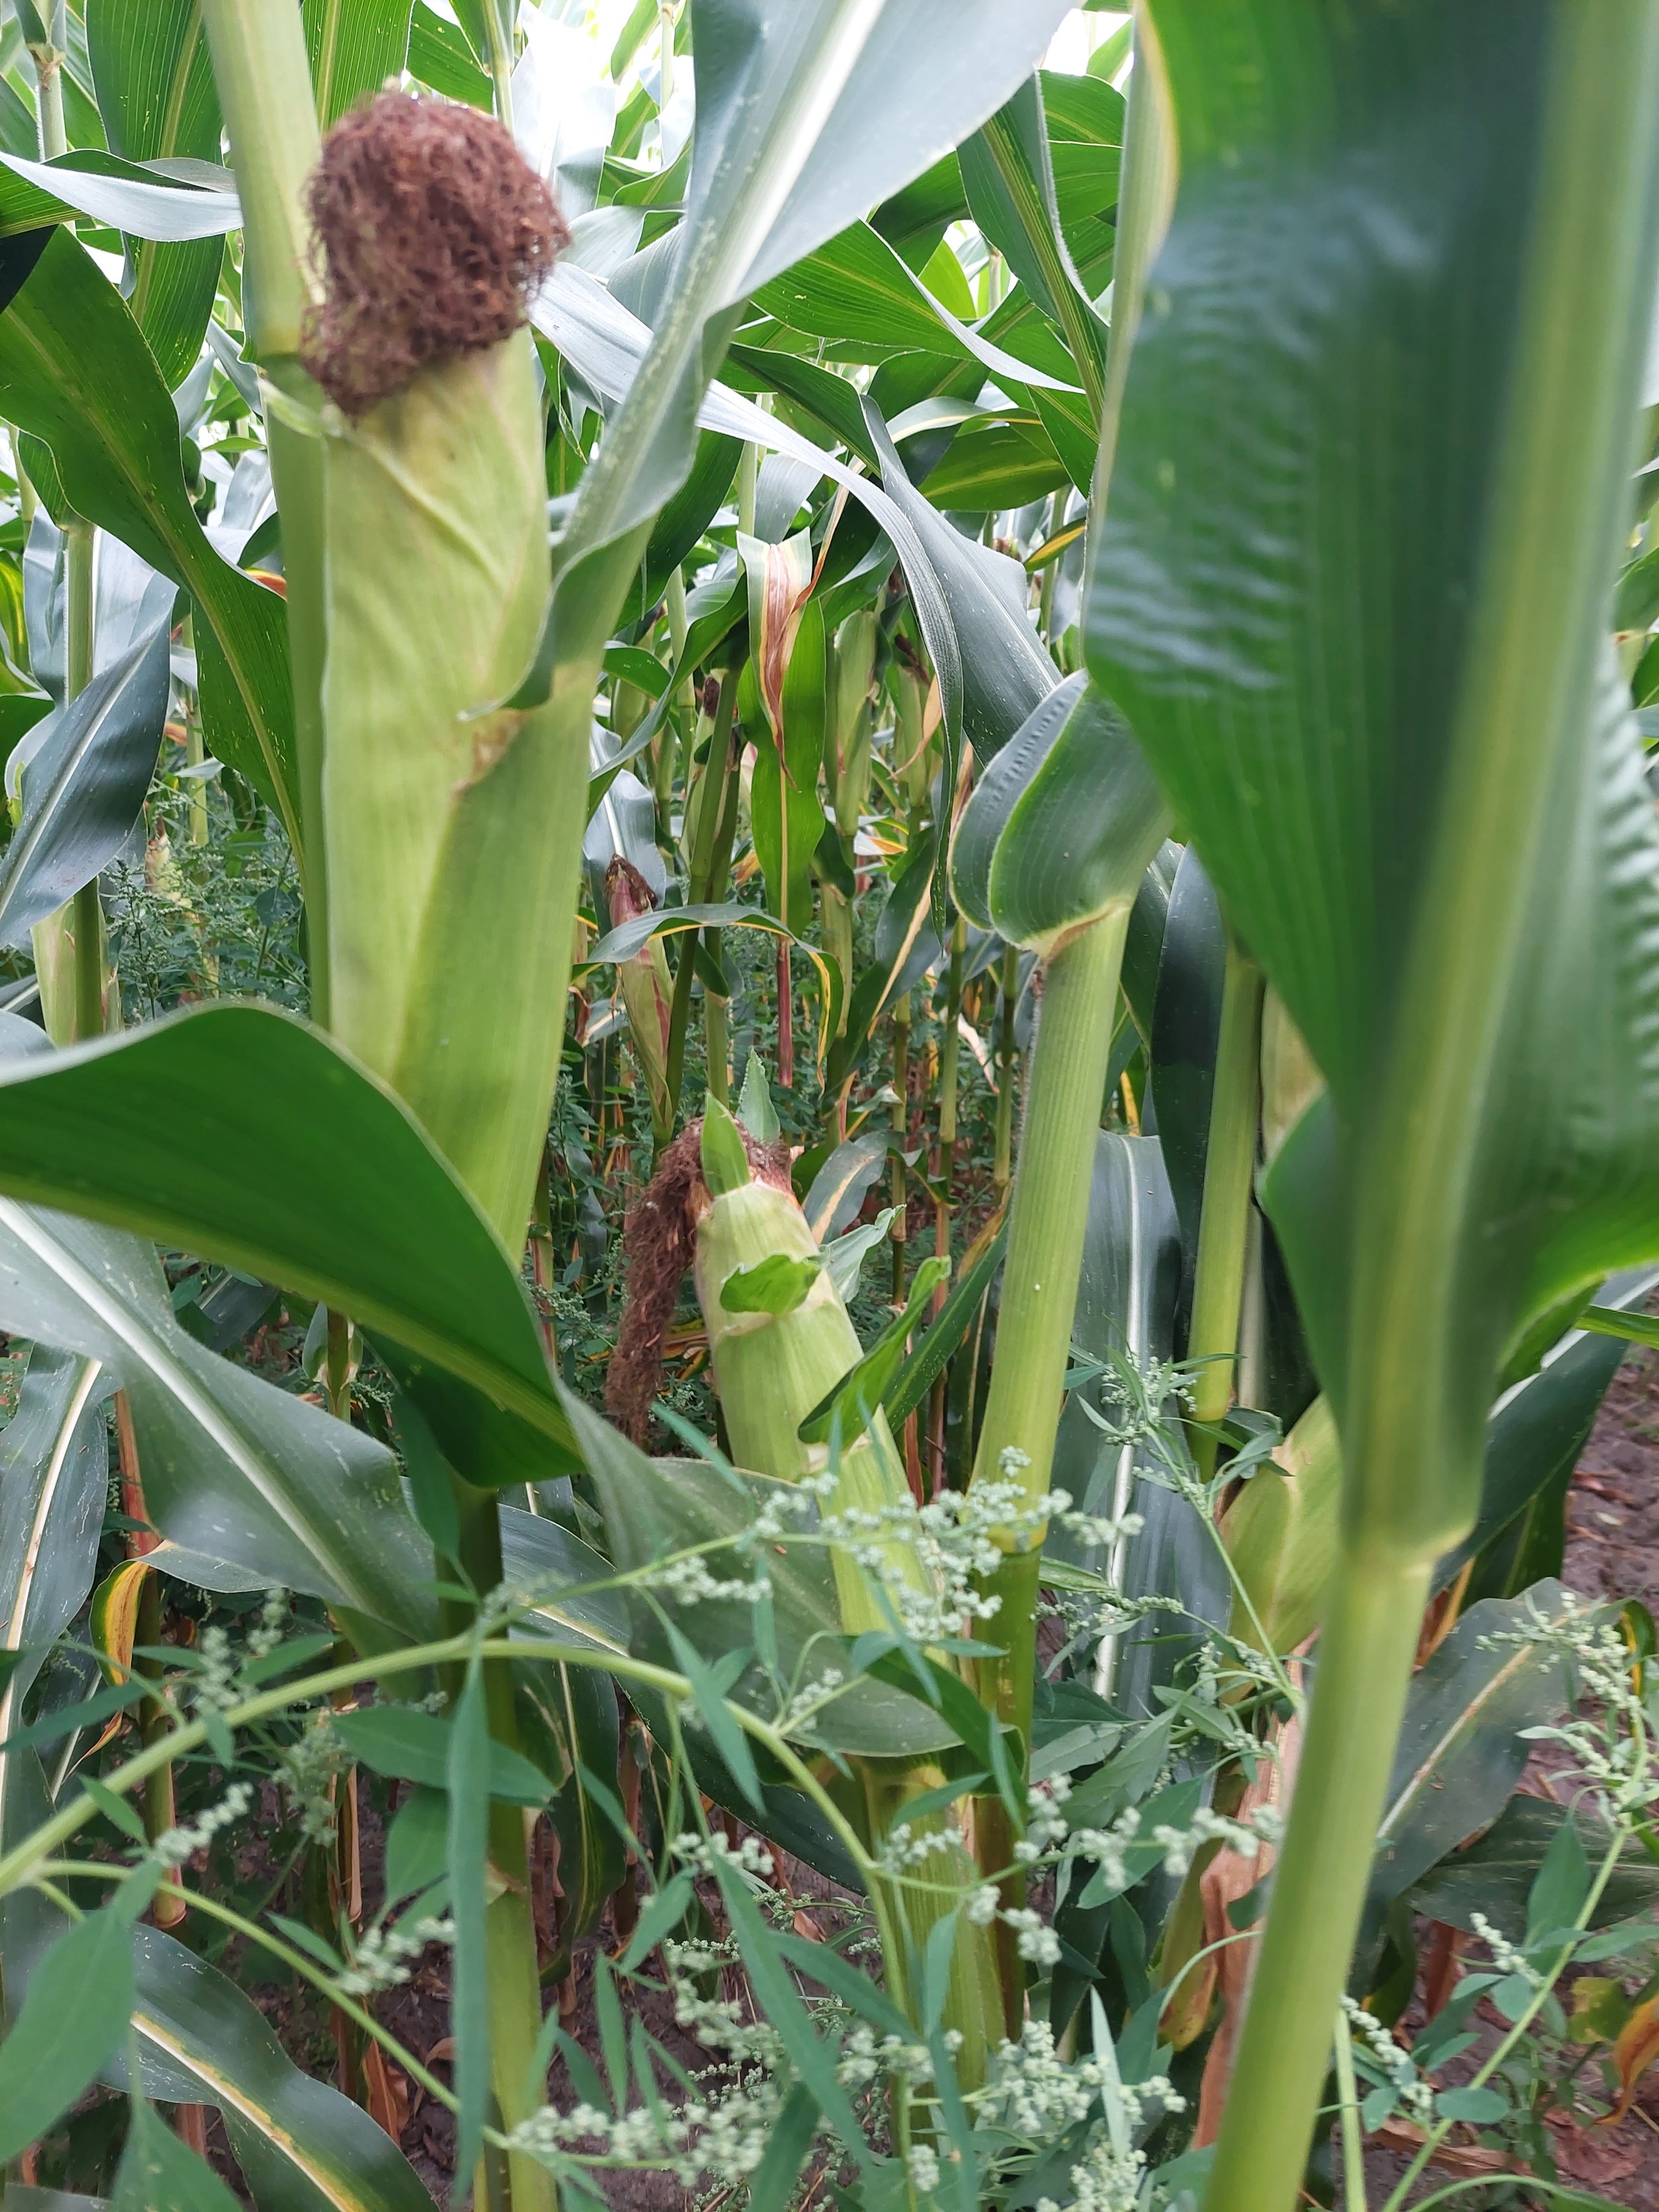
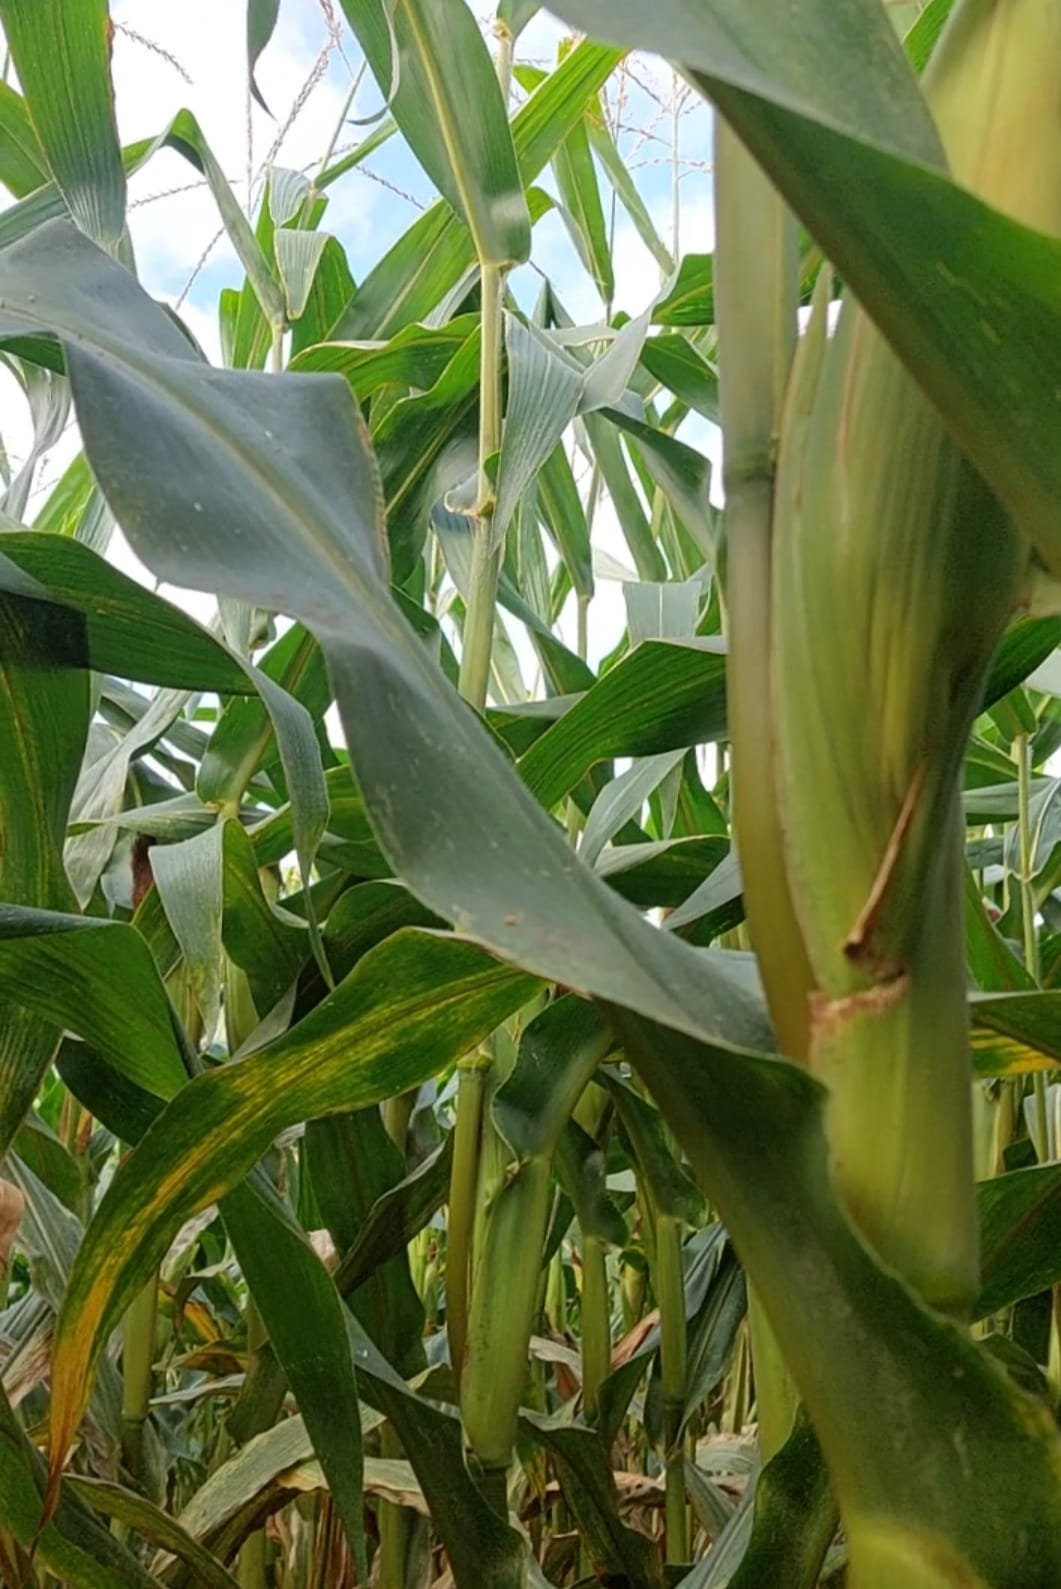
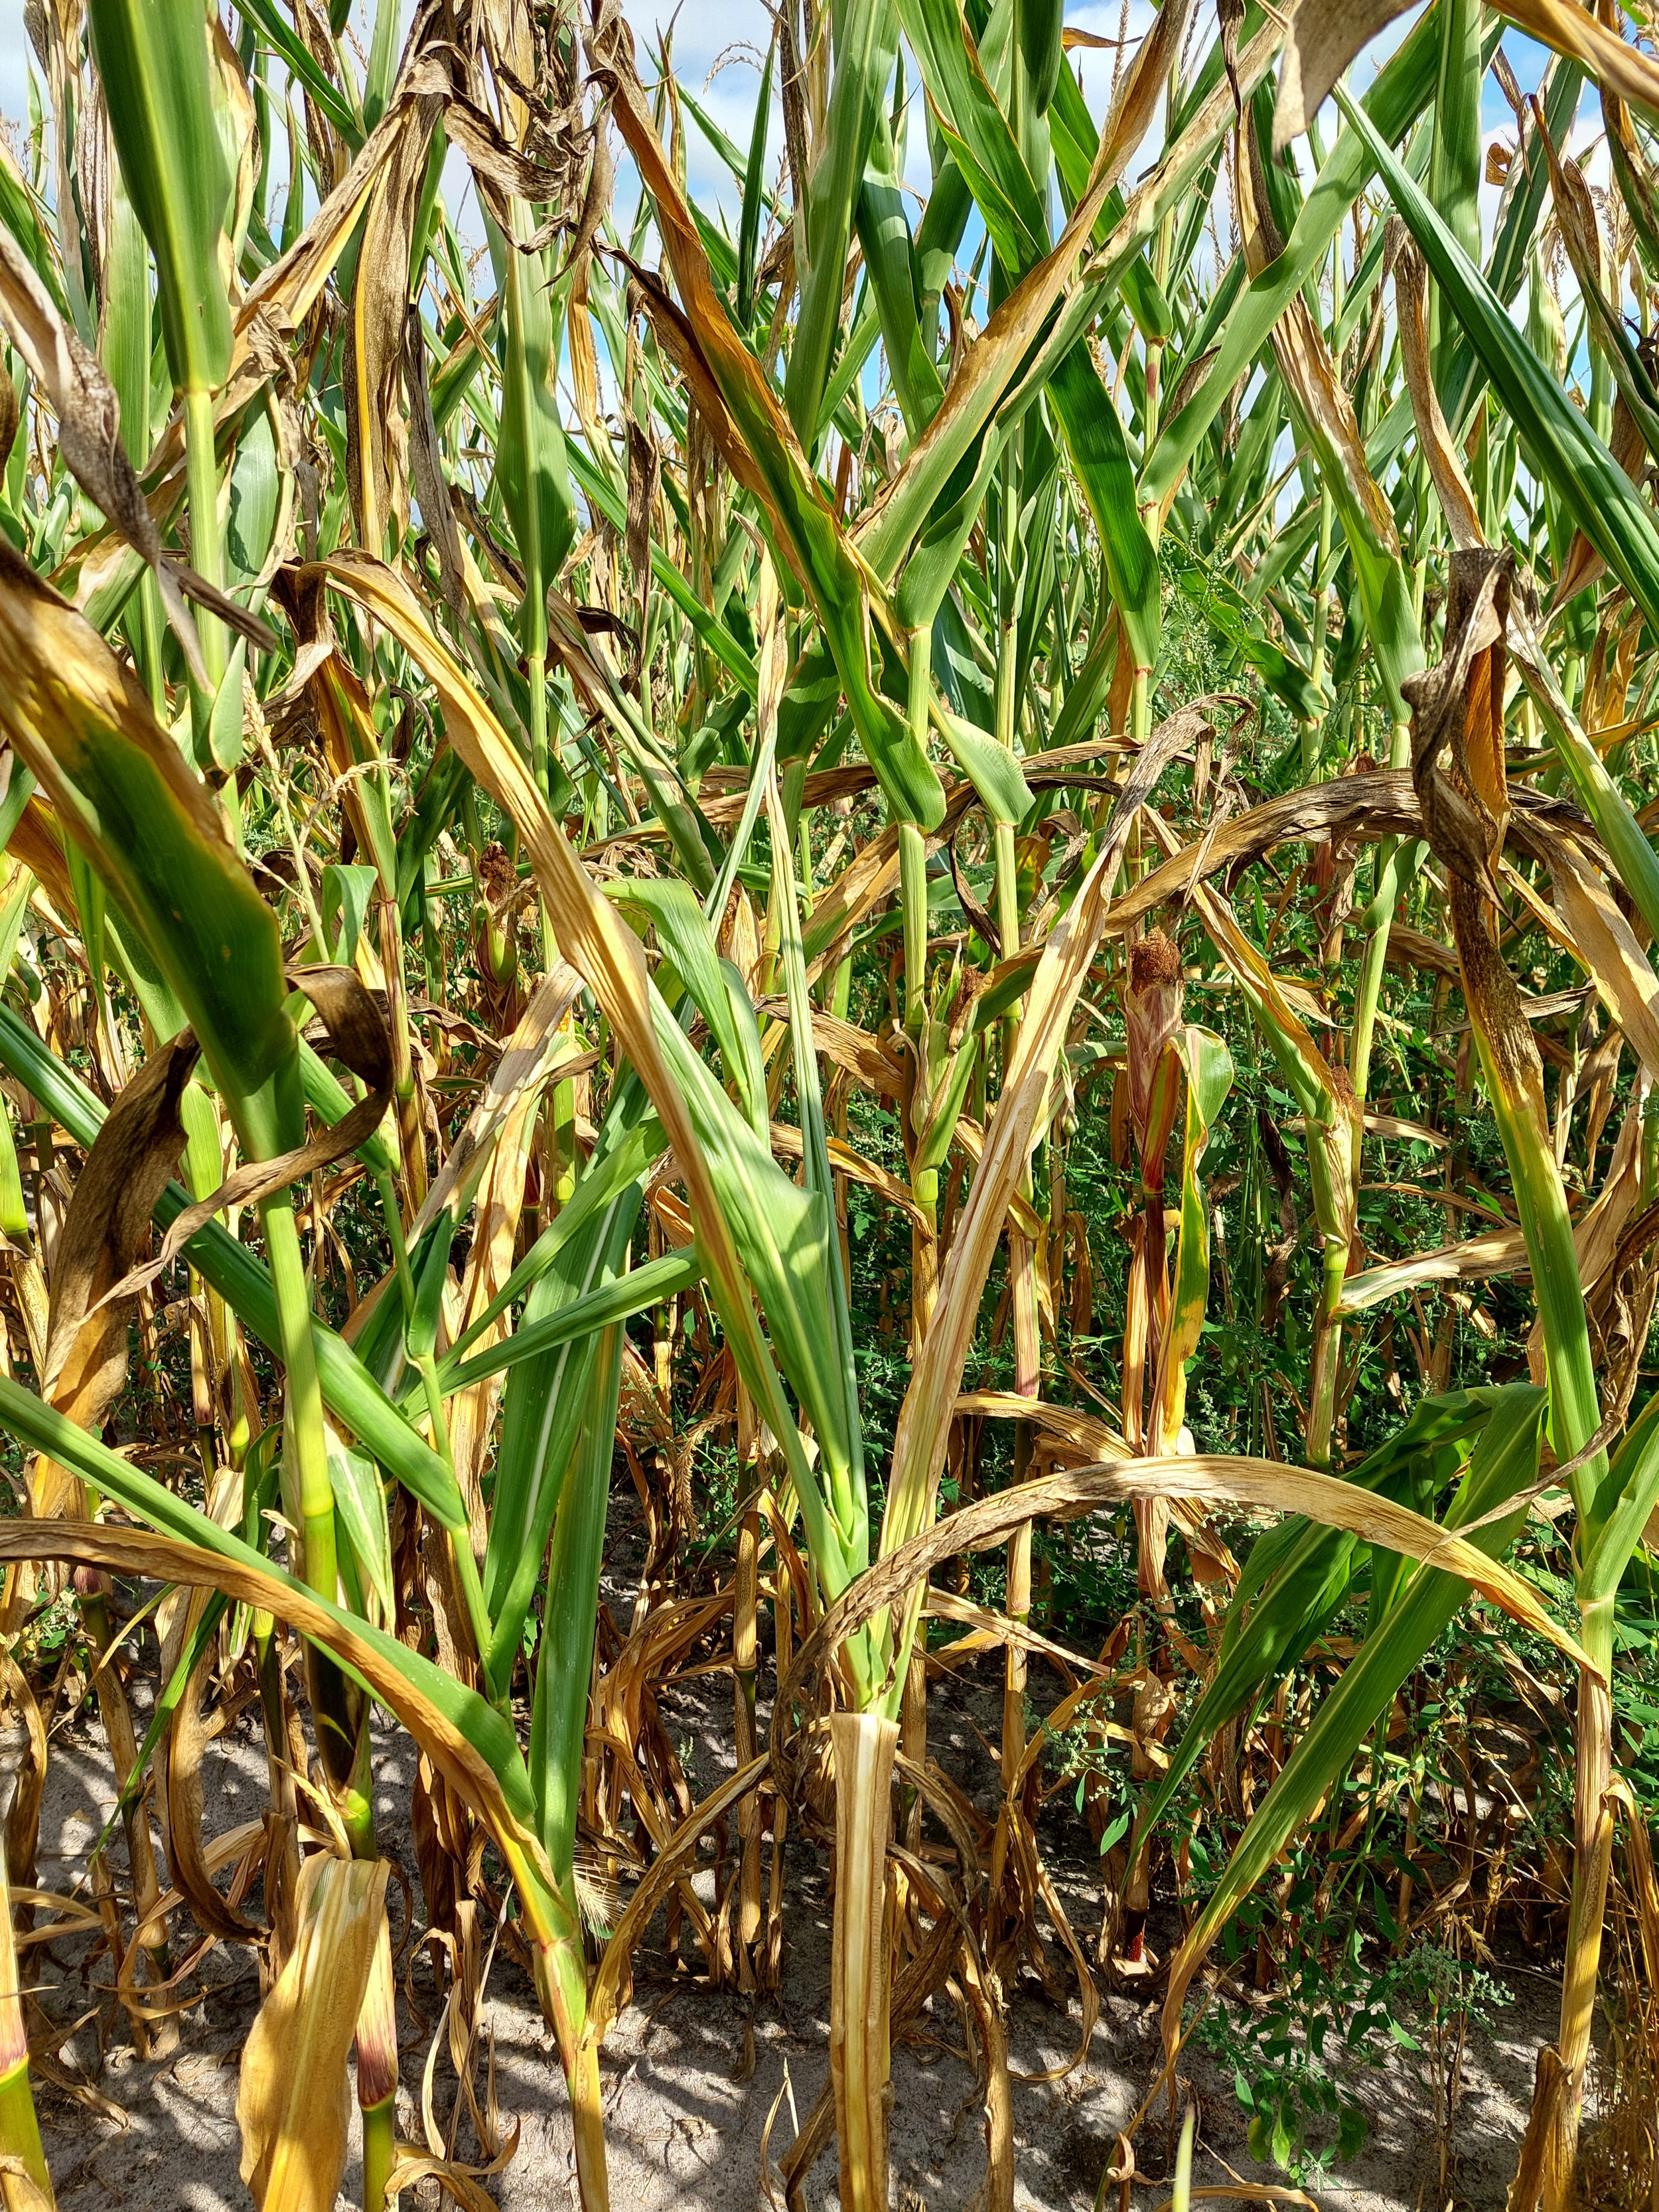
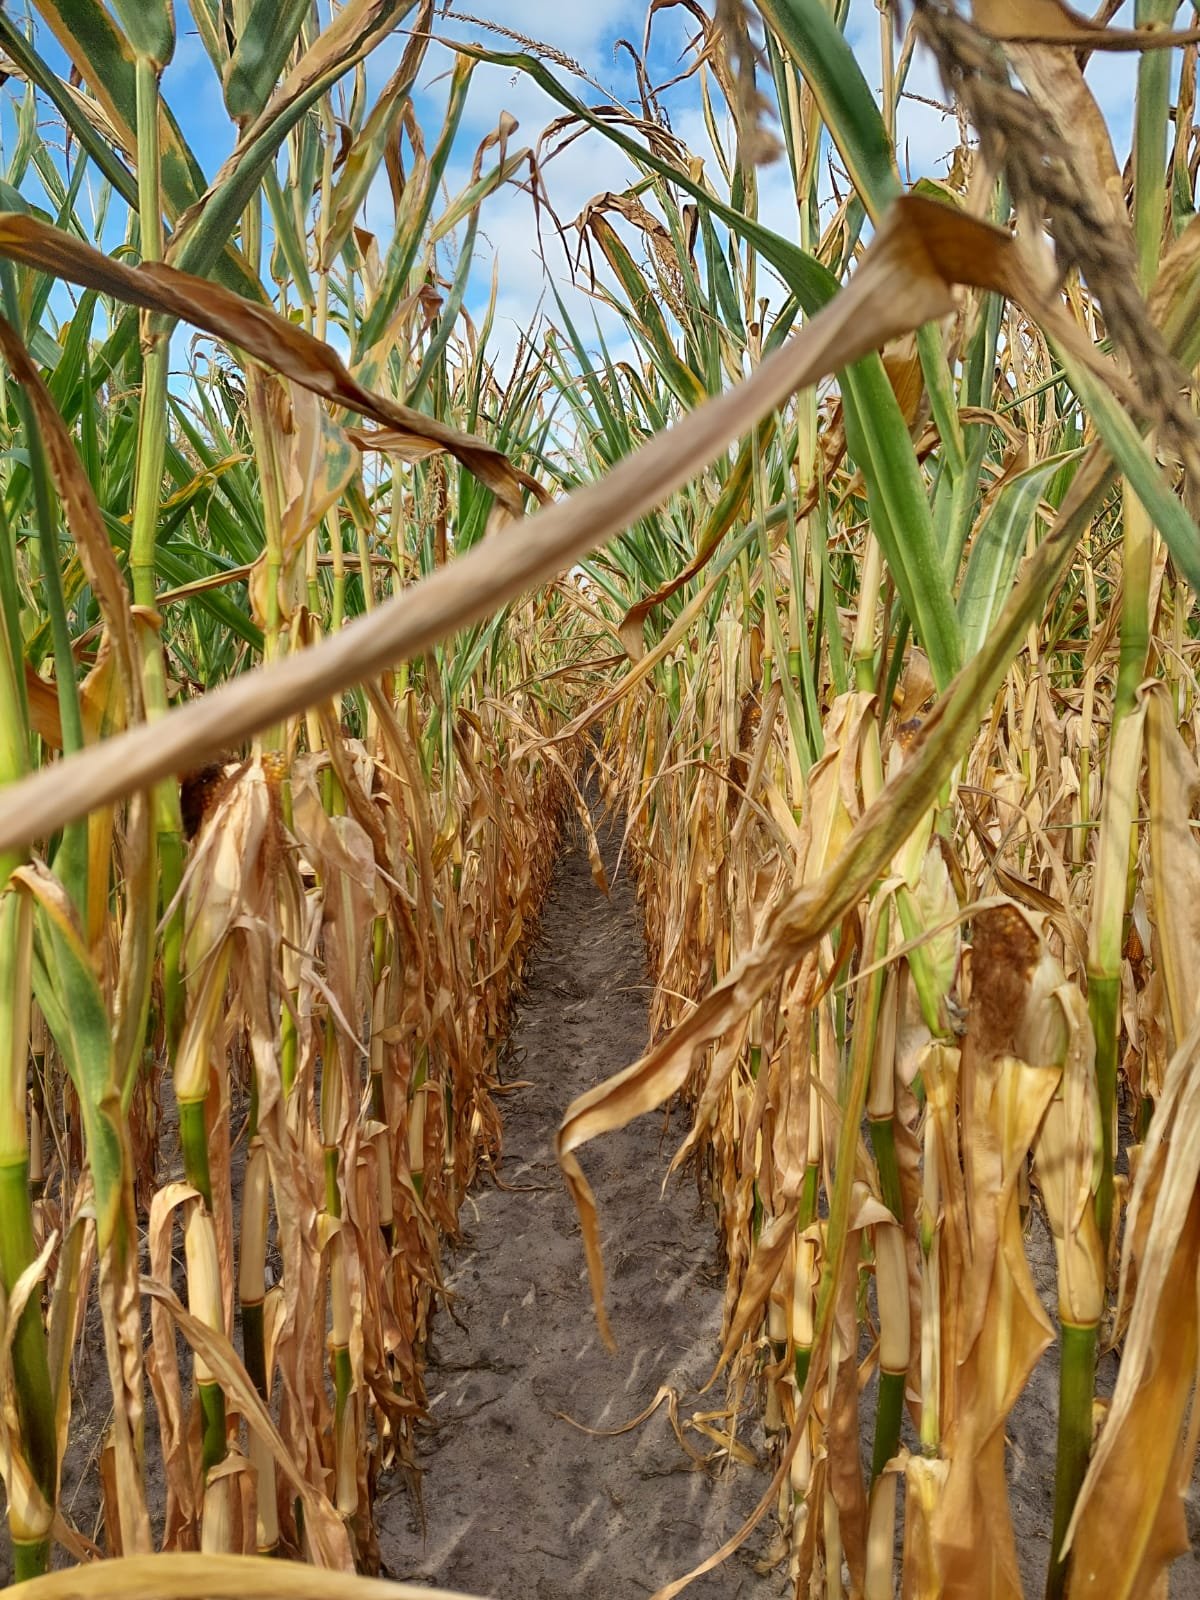
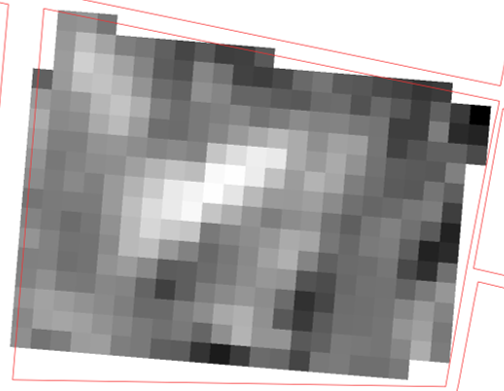
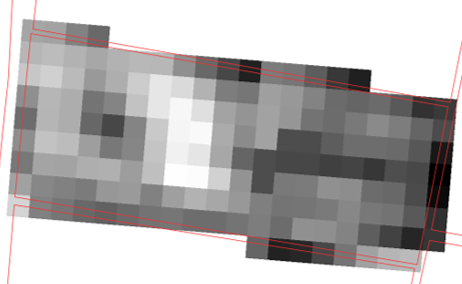
In AgriWatch, we used satellite images with different spatial resolution from 10 meter to 50 cm and drone images with spatial resolution of about 2 cm in order to accurately investigate the effects of drought in sample fields in the eastern part of the Netherlands. The advantage of satellite images is the possibility of continuous imaging in different time frames, the existence of multiple spectral bands and lower cost in data access and processing, and the advantage of drone data is higher spatial resolution and less dependence on cloud cover in the region. Below is an example of the above mentioned satellite and drone images from the end of August 2022, which shows the severe impact of water stress on the two sample corn fields in the Rekken region, east of the Netherlands. Satellite image was acquired by ESA at 25th August 2022, drone and ground images are all taken by AgriWatch.
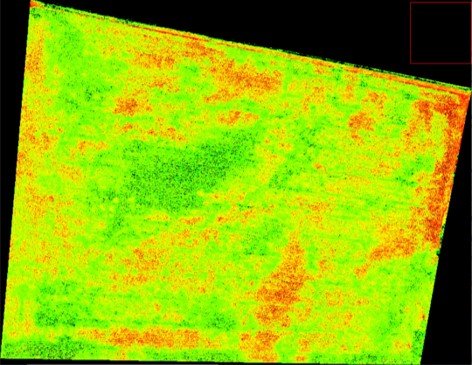
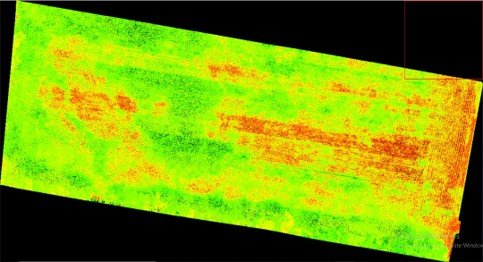
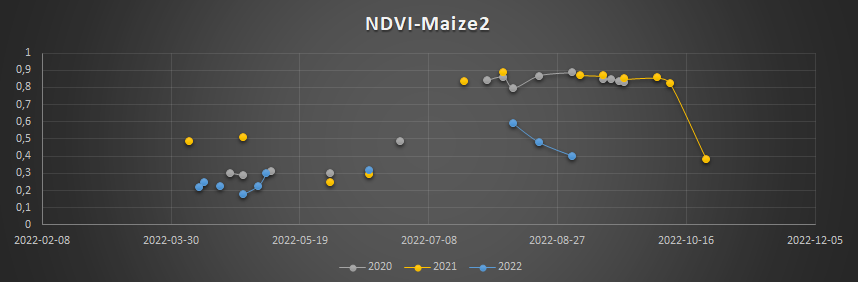
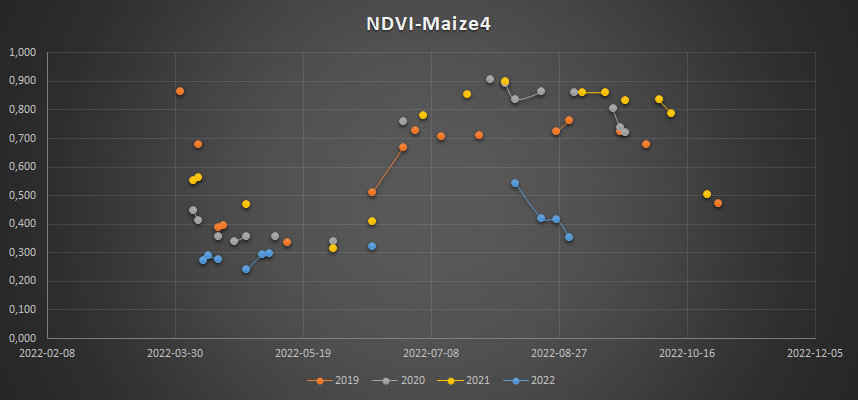
Figure (13) and Figure (14) illustrate NDVI variations since 2020 at Maize2 and Maize4 respectively, computed from Sentinel-2 satellite data. Blue dots which are NDVI vegetation index variations in 2022 , show a dramatic reduction compare to 2020 and 2021 at both sample fields, illustrates high water stress, less greenness and therefor less productivity in 2022.

Figure (2): Sentinel-2 true color image (10 meter spatial resolution) of two sample maize fields (namely Maize2 and Maize4), Date: 25th August 2022, Rekken, The Netherlands