
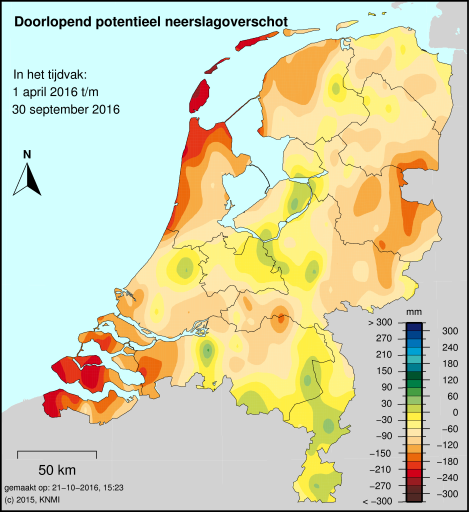
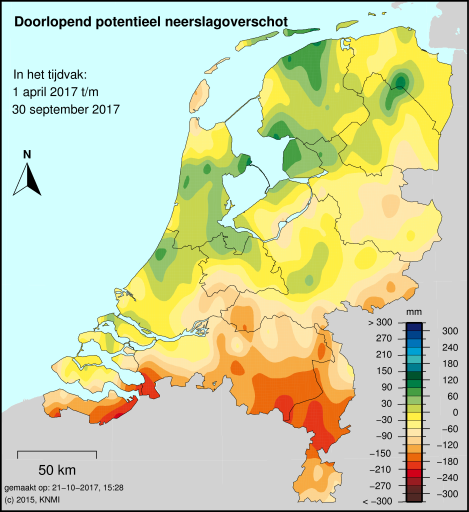
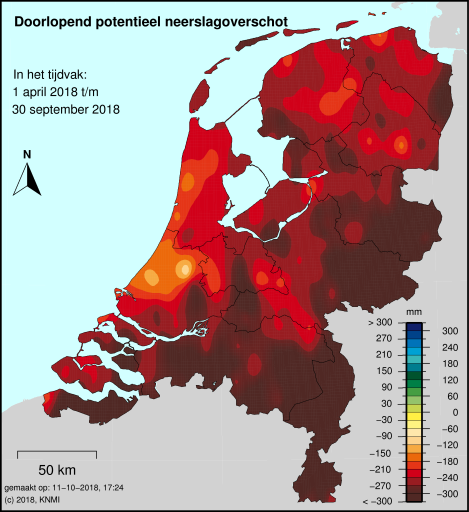
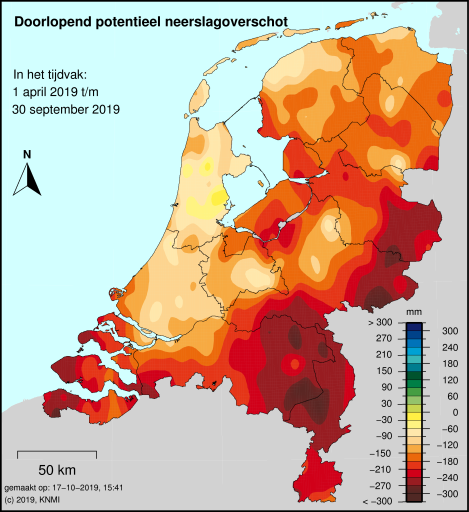
5.3 Continuous precipitation surplus
Archief doorlopend potentieel neerslagoverschot (gevalideerde data)
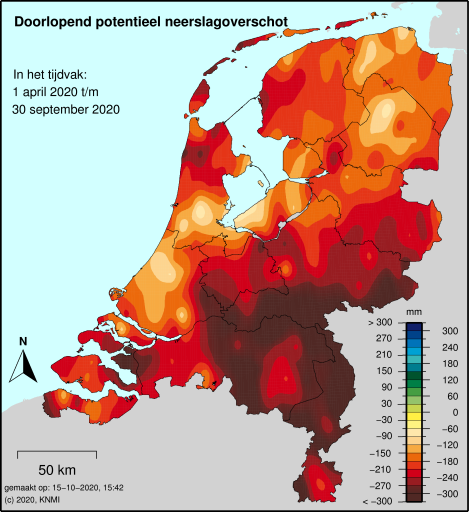
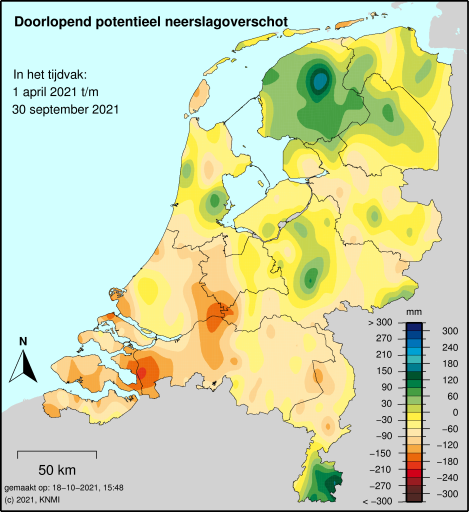
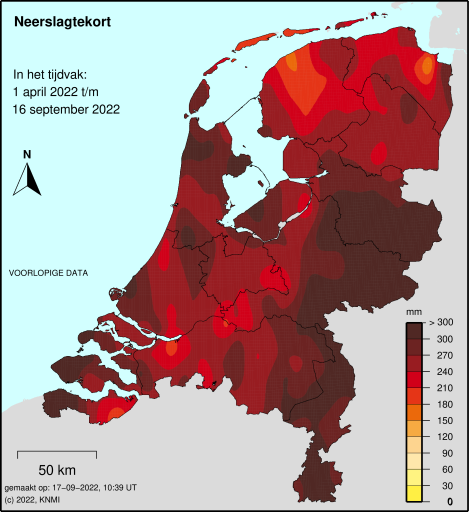
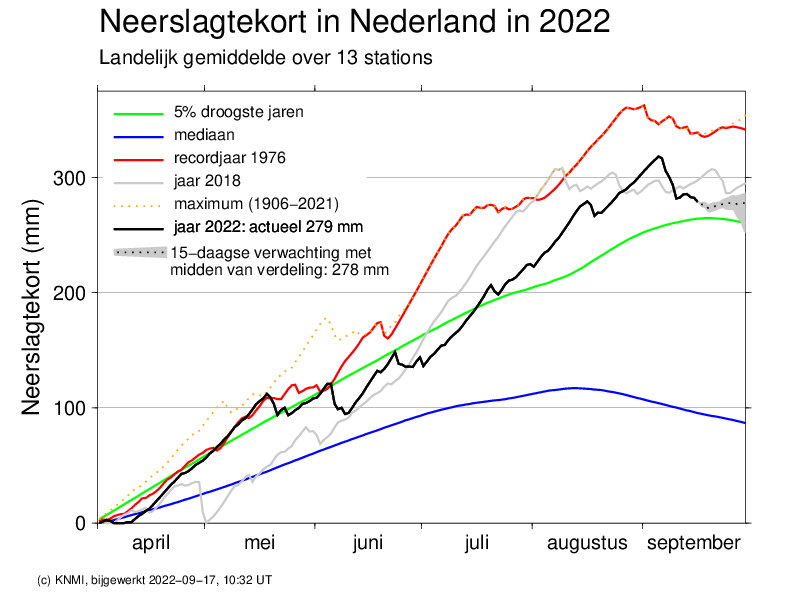
The KNMI not only keeps track of how much precipitation falls, but also how much moisture disappears: evaporation.
The maps of the continuous potential precipitation surplus (in millimeters) = the difference between the amount of precipitation and the calculated reference crop evaporation. This difference is summed daily in the period from 1 April to 30 September. A negative number indicates a deficit, a positive number indicates a surplus.
KNMI Continuous potential precipitation surplus and ongoing potential precipitation surplus - More information: https://www.knmi.nl/nederland-nu/klimatologie/geografische-overzichten/archief-neerslagoverschot
Achtergrond
Achtergrondinformatie doorlopend potentieel neerslagoverschot - https://www.knmi.nl/kennis-en-datacentrum/achtergrond/Achtergrondinformatie-doorlopend-potentieel-neerslagoverschot