3.3 Maize day 2020
Introduction
Present the #Maisdagen in #ResearchArea collected #DroneData on 13 September 2020 and #DroneProducts to #EndUser for discussions. Drone products include the #Orthomosaic and #PlantHealth map of the Maize Field Trials.
Measurements
Study area and Fields
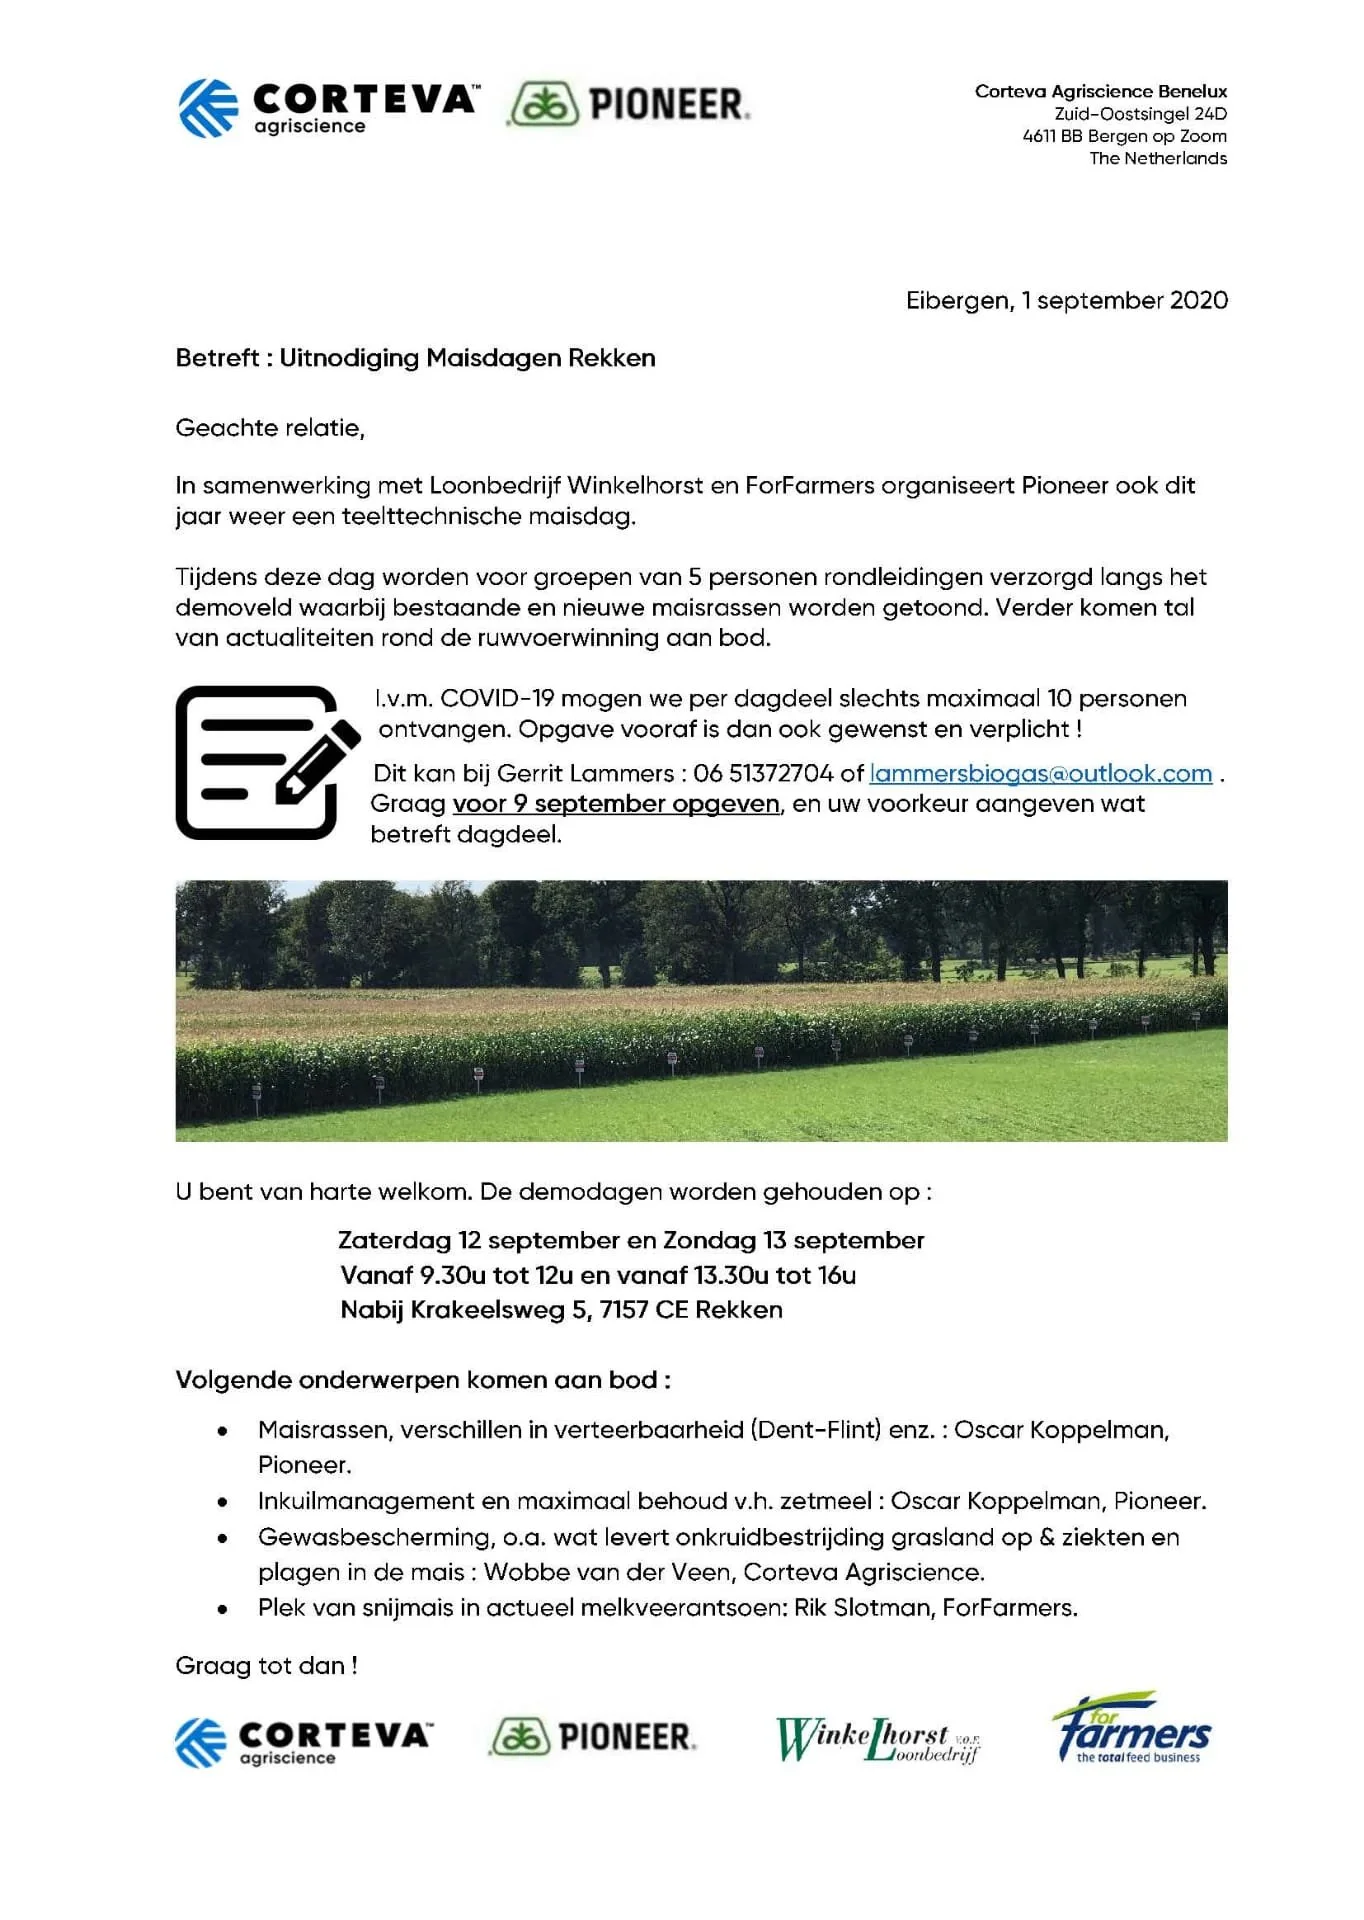
The location of the study area is shown below including information on the trial maize field (Maisdag, Maisrassen, 1 ha) in the growing season of 2020.
Planning parameters settings for the drone flight maisdagen in the research area and access and synchronization to the AgriWatch cloud storage and mobile application:
Research area and drone flight planning used in this experiment, maisdagen 2020, in relation to a larger AgriWatch research area.
The outlines of the maisdagen research study area for Maize varieties, 2d map view, 3d view and 3d terrain views for executed flight (Altitude 40; Pitch 90°; Stop & Go) are shown below:
Drone images
Captured drone images: 13 September 2020 and processing:
State of Maize varieties in Drone images
Visible differences in plume reflectance due to seed and heat-stress differences. Dark to light green and brown colours transition: different seeds, and brown colours: heat-stress; seeds drought resistance!
View Orthomosaic Coverage
Orthomosaic and Plant Health map of the Maize Fiel Trials.
Orthomosaic drone data was captured on 13 September 2020 from the Maize trial field and Grassland, trees and bare soil. The mosaic shows different maize varieties. The Maize plants were under stress after a number of sweltering days in the first two weeks of August 2020 in Achterhoek.
Maize plant stress map
The map shows possible maize varieties and drought conditions. The variation is due to seed and drought-stress differences including soil variation. The boundaries between the different types of seeds can be seen and the statistical info can be derived.
data analysis on health variations within field zones (e.g., Border zone as affected by soil compaction).
evaluation of seed quality, and assess field damages.
mapping the areas affected by drought and varying drought conditions, and assessing their current drought status.
classify the zones of potential yield losses.
The map shows the variation due to maize varieties and drought stress differences (including soil variation).
Digital Surface Model
The figure below shows that in the upper NW part of the trial field, maize plants are taller than in the lower SE part. This could be due to soil and management practices variations visible in the satellite images during the land preparation stage of the growing season in 2020. The average height of the maize plants: is 2.50 to 3 meters based on expert knowledge.
The image shows the digital surface model. The image shows the height variation due to drought stress. In the upper NW part of the trial field, maize plants are taller than the lower SE part.
Satellite data
#DroughtManagement during the growing season could be also based on early satellite data:
2020-09-17, SuperView satellite image, different maize varieties, drought-stress effects
Contact information
For more information see the AgriWatch page


