
Grijsen MT Study Area


Map layout
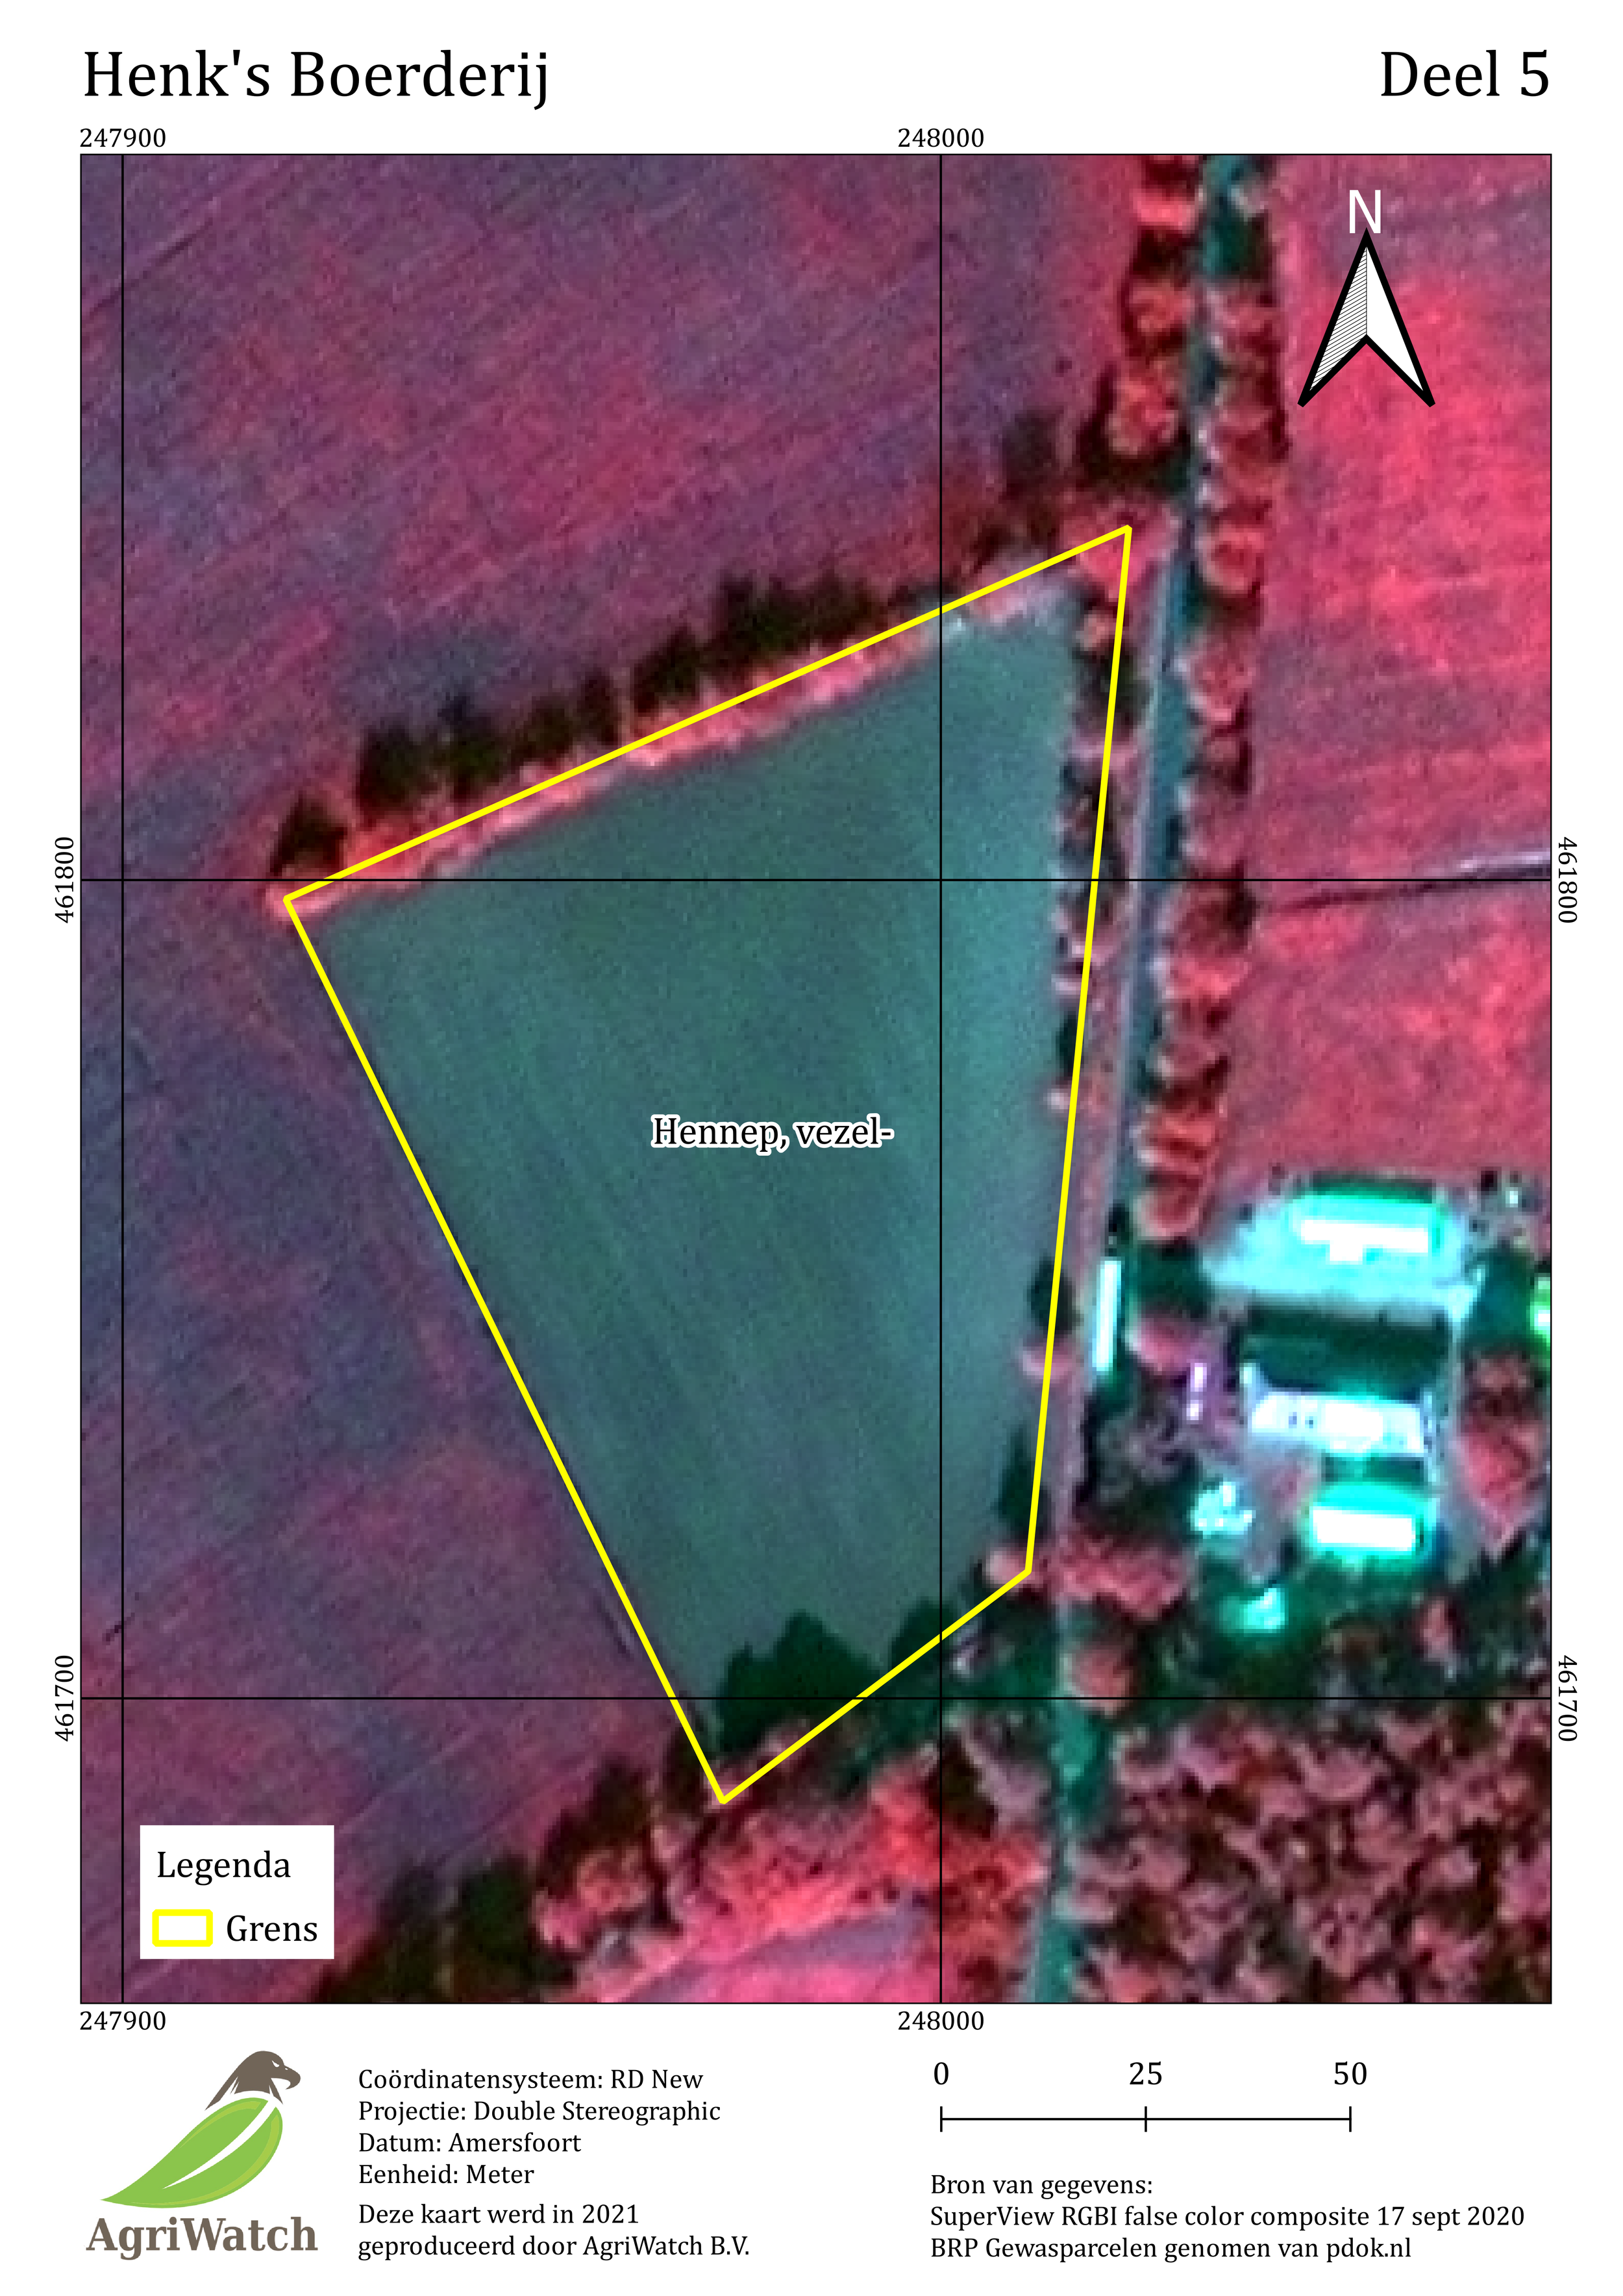
There are five parts of Henk’s farm (Deel 1 – 5) and each part is visualized in three different satellite image colour composites, which are RGB, false-colour composite, and pseudo-colour composite. Therefore, ideally, there are 15 maps. However, due to layout, the farm’s part is each on a different scale, thus effecting the map grid. There are 3 different map grids, they are 1km, 0.5 km, and 100 metres.
For example, Henk’s Farm Deel 1 and Deel 2 can be visualized in map grid 1km and 500 meters. But Deel 3, 4, and 5 are smaller farms (smaller parts) therefore better to be visualized in a map grid of 500 meters and even smaller, 100 meters.

Structure and File names
Aim: “Question: Where/Which Parcel?"
The aim is how to communicate with farmers to acquire the required extra info, parcel numbers and plans for the current growing season. This is done using the concept of “WiKi Knowledge Portal”.
For example, for the definition of ROI (Region of Ineterest):
Klopt de rode grens van uw boerderij? Laat anders met een tekening de juiste zien waar we een perceel moeten toevoegen of verwijderen. alle parceel gebaseerd op Basisregistratie Gewaspercelen (BRP).
de achtergrondfoto is het satellietbeeld van 17 september 2020.
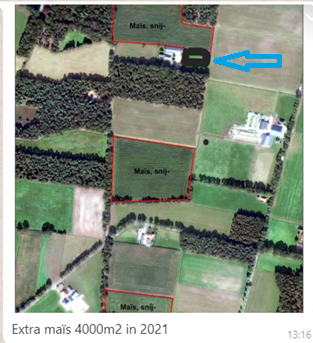
Henk: Rode lijn klopt niet
kun je tekenen waar het niet klopt
See figure below.

Observations: Note the following
Index maps, eg, to only the maize fields, will try to link them to the bijgekocht2020 excel file.
This raises the question of a uniform system of report generation in the Farm Management Information System.
The relation between the crop and the adjacent objects such as trees.
How to make and display prediction (variation in) zet meel (starch) production map and communicate this info effectively with the farmer for daily management.
build link to provided images and maps connected to farmers.
and satellite data acquisition through satellite data portals at key stages of crop growth and integrating with the farm info of fields.
Cloud detection and masking.
The regular updating of the satellite data makes it possible to follow the vegetation growth development of the field crops and therefore increases confidence in your decisions.
finally feature extraction, classification and planning for drone data acqusition and mapping.


Based on the expected drought damage (maps, images, link index to estimated loss in mass and quality), how much corn/grass (replacement) had to be purchased externally? Where, when and how did the shortages arise?
This exercise is useful for shaping our knowledge base by focussing on queries that are relevant for "farm business operation/bedrijfsvoering".