
2.1 Vegetation Condition Index (VCI)
Written by Ali Naeini
Spectral vegetation indices are among the most commonly used satellite data products for evaluation, monitoring, and measurement of vegetation cover, condition, biophysical processes, and changes. Thus, we would also cover it here briefly with its application for drought monitoring. Kogan [1] proposed a Vegetation Condition Index (VCI) based on the relative Normalized Difference Vegetation Index (NDVI) change with respect to the minimum historical NDVI value. The VCI, therefore, compares the current Vegetation Index (VI) such as NDVI or Enhanced Vegetation Index (EVI) to the values observed in the same period in previous years within a specific pixel.
The VCI is calculated as shown below,

where VCIijk is the VCI value for the pixel i during week/month/DOY j for year k (current year), VIijk is the weekly/monthly/DOYs VI value for pixel i in week/month/DOY j for year k whereby both the NDVI or EVI can utilized as VI, VIi,min and VIi,max are the multiyear minimum and maximum VI, respectively, for pixel I during week/month/DOY j. The resulting percentage of the observed value is situated between the extreme values (minimum and maximum) in the previous years. Lower and higher values therefore indicate bad and good vegetation state conditions, respectively. If we don’t use VI of year K (current year) to calculate VIi, min and VIi,max, we may get values more than 1 (for VIijk > VIi,max ) or less than 0 (for VIijk < VIi,min), showing best and worst conditions compare to multiyear conditions, respectively.

In most cases VCI is calculated based on Maximum Value Composites (MVC) of NDVI data, some available products are:
From ESA-Copernicus project: 10-day VCIs (from 10 days NDVI) since June-2014, form PROBA-V satellite data with 1Km spatial resolution.
From NOAA: 7-day VCIs (from 7 days NDVI) since 1995, form NOAA-AVHRR satellite data with 4Km spatial resolution.
For this project, we used 16 days MODIS-NDVI MVCs since 18 Feb 2000 with 250m spatial resolution to calculate 16 days VCI. It should be noted that since the NDVI value of water is less than NDVI of bare soil, in case in a specific pixel there is a change from water to soil then VCI value will be increased and shows no drought conditions.

250meter VCI, for 22 April until 7 May 2020, calculated based on Min and Max NDVI values of the year 2000 to 2019 for the same period (for the whole calculated area). Colours are:
Brown: 0<VCI<0.2
Red: 0.2<VCI<0.4
Yellow: 0.4<VCI<0.6
Green: 0.6<VCI<1
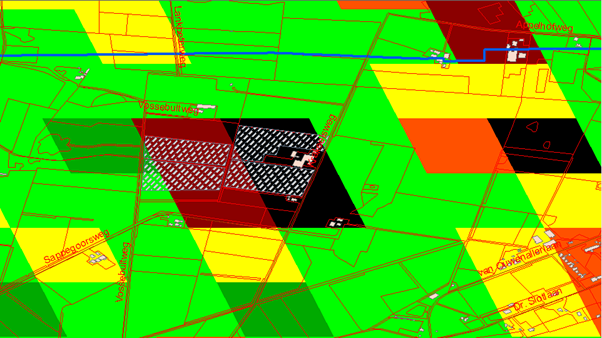
250meter VCI , for 22 April until 7 May 2020, calculated based on Min and Max NDVI values of year 2000 to 2019 for the same period (for Henk’s Frams as hatched fields). Colours are:
Black: VCI<0 (worse than all situations between 2000 to 2019 at this time period)
Brown: 0<VCI<0.2
Red: 0.2<VCI<0.4
Yellow: 0.4<VCI<0.6
Light Green: 0.6<VCI<1
Dark Green: VCI>1 (better than all situations between 2000 to 2019 at this period)
(Blue Line: boundary of Overijssl and Gelderland provinces)
References
[1] Kogan, F. N. F. Remote sensing of weather impacts on vegetation in non-homogeneous areas. International Journal of Remote Sensing 1990, 11, 1405–1419.