2.6 Vegetation Condition Index (VCI), 2022 compared to 2000-2016
Written By Ali Naeini
Below you can find Vegetation Condition Index (VCI) for some time periods (each lasting 16 days) in 2022 compared to the min and max NDVI values for the same time period between 2000 and 2016. Results shows starting of drought since June 2022 and dramatically growing since July 2022.
All VCIs were produced using NASA’s TERRA-MODIS imagery (pixel size=250 meters).
For more information about the VCI index see this Webpage.
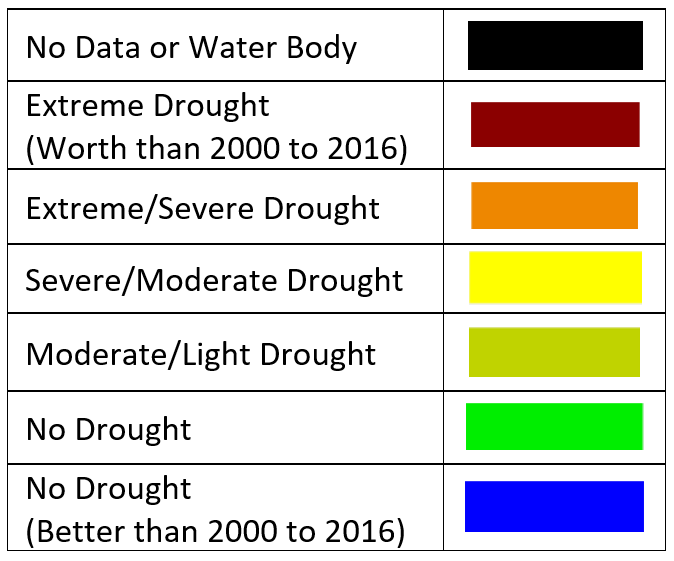
Colors in VCI products

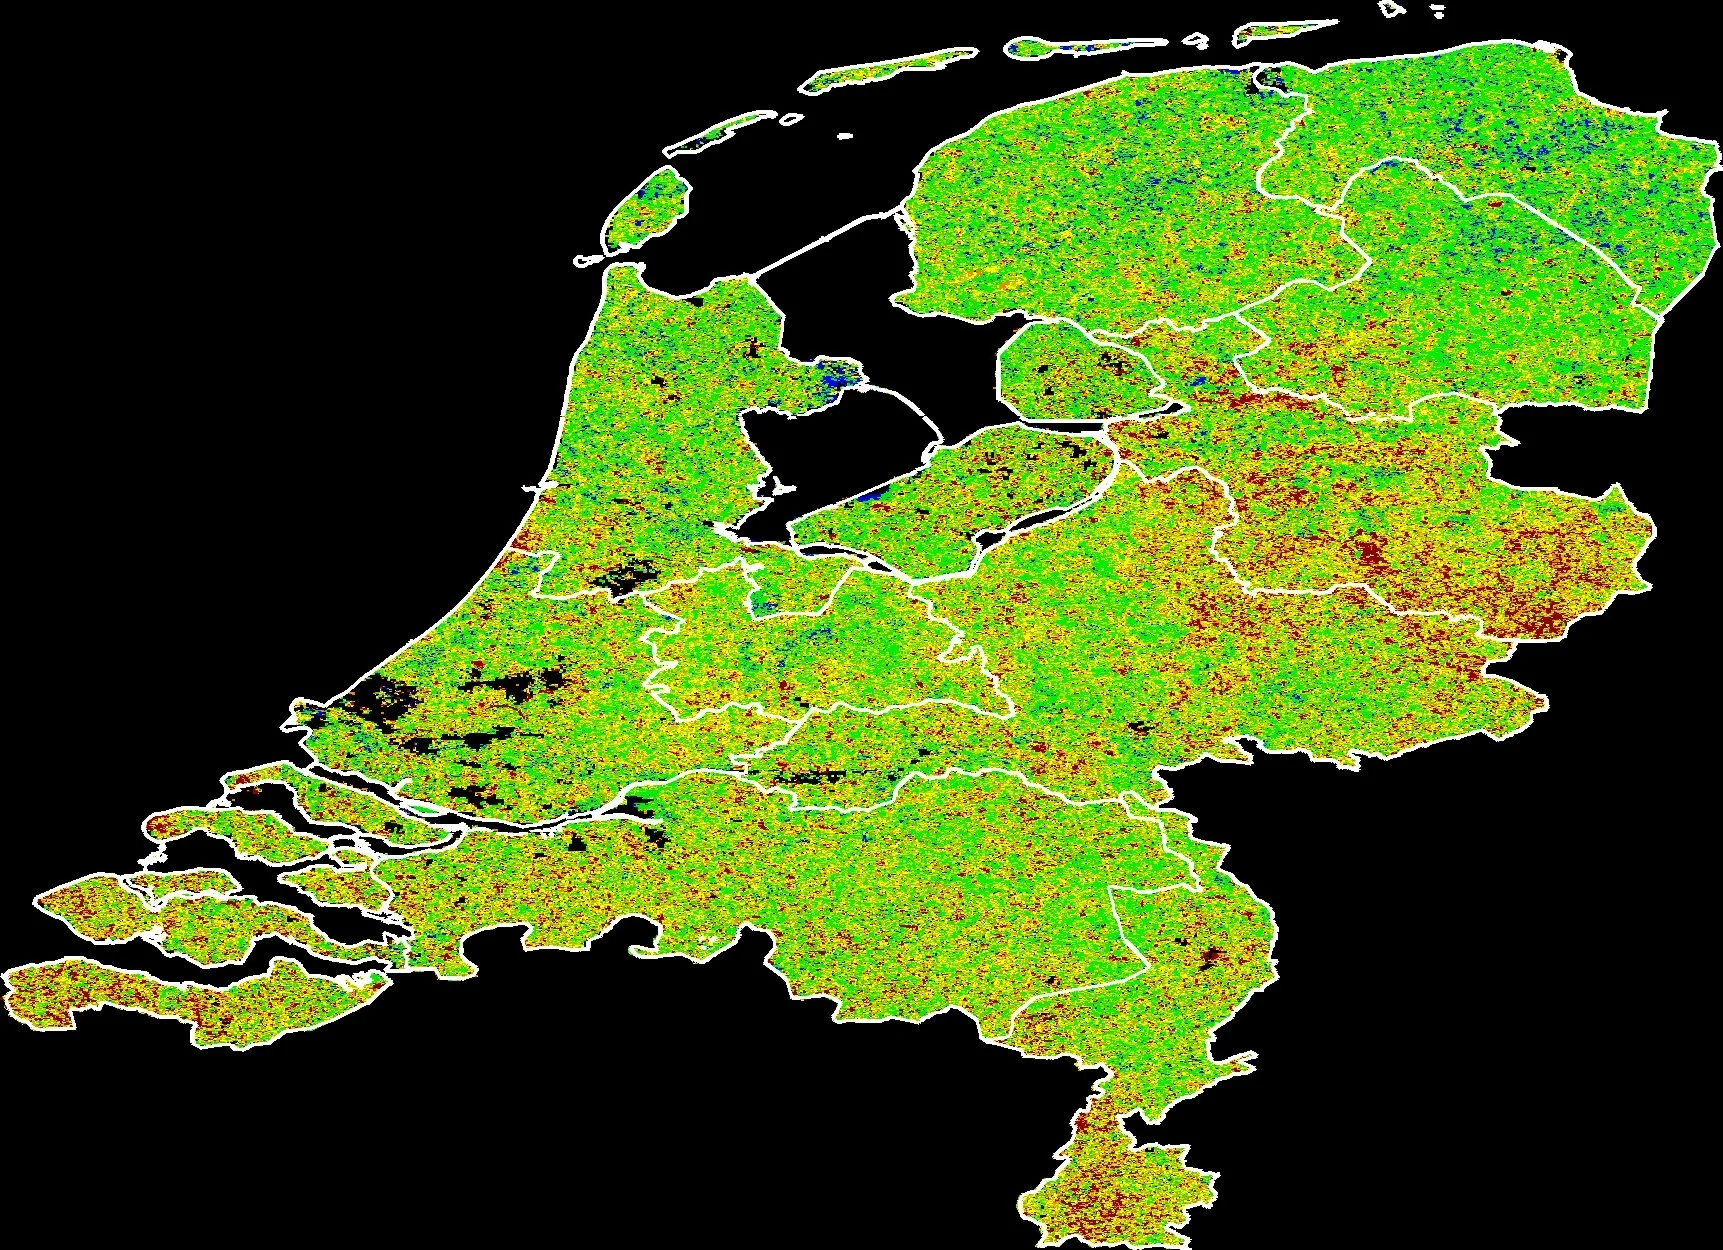
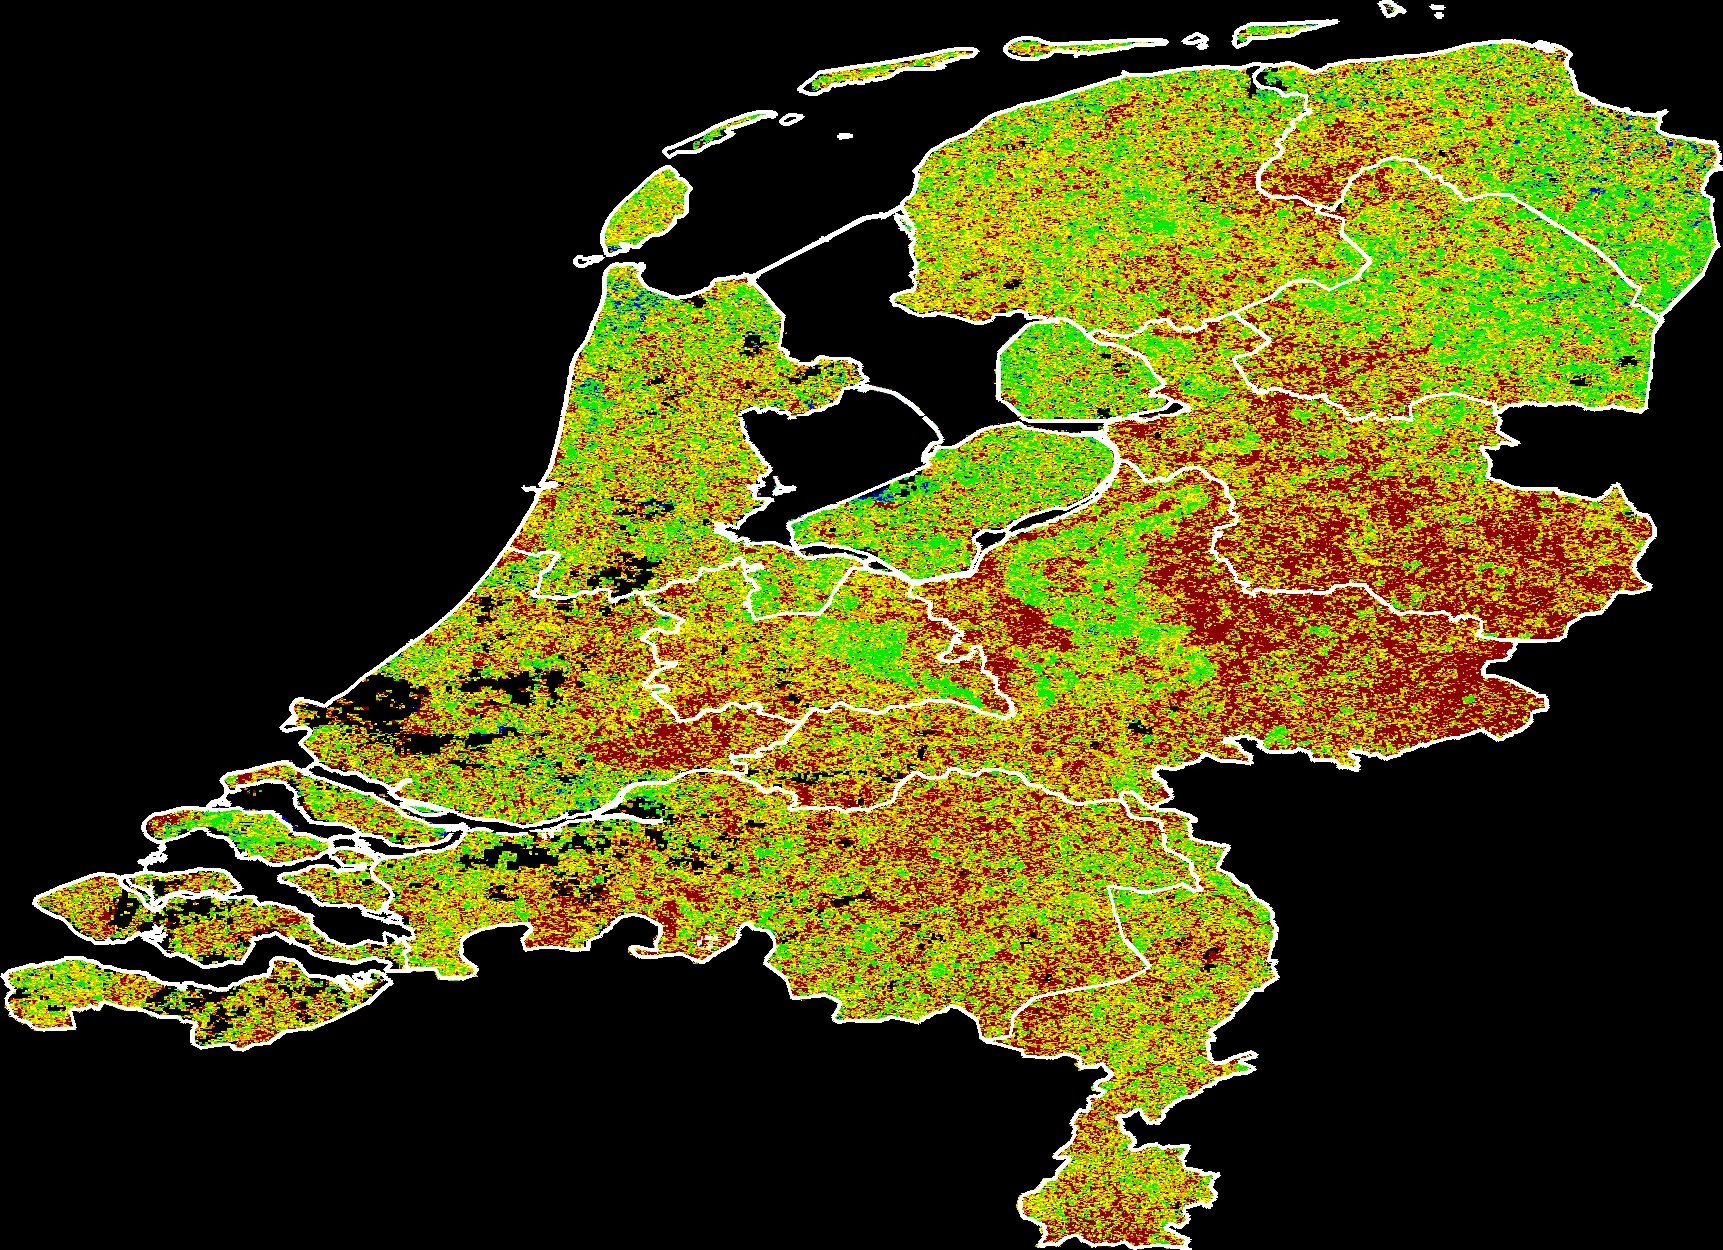
VCI index for 7 April to 22 April 2022 compared to the vegetation situation at the same time period between 2000 to 2016

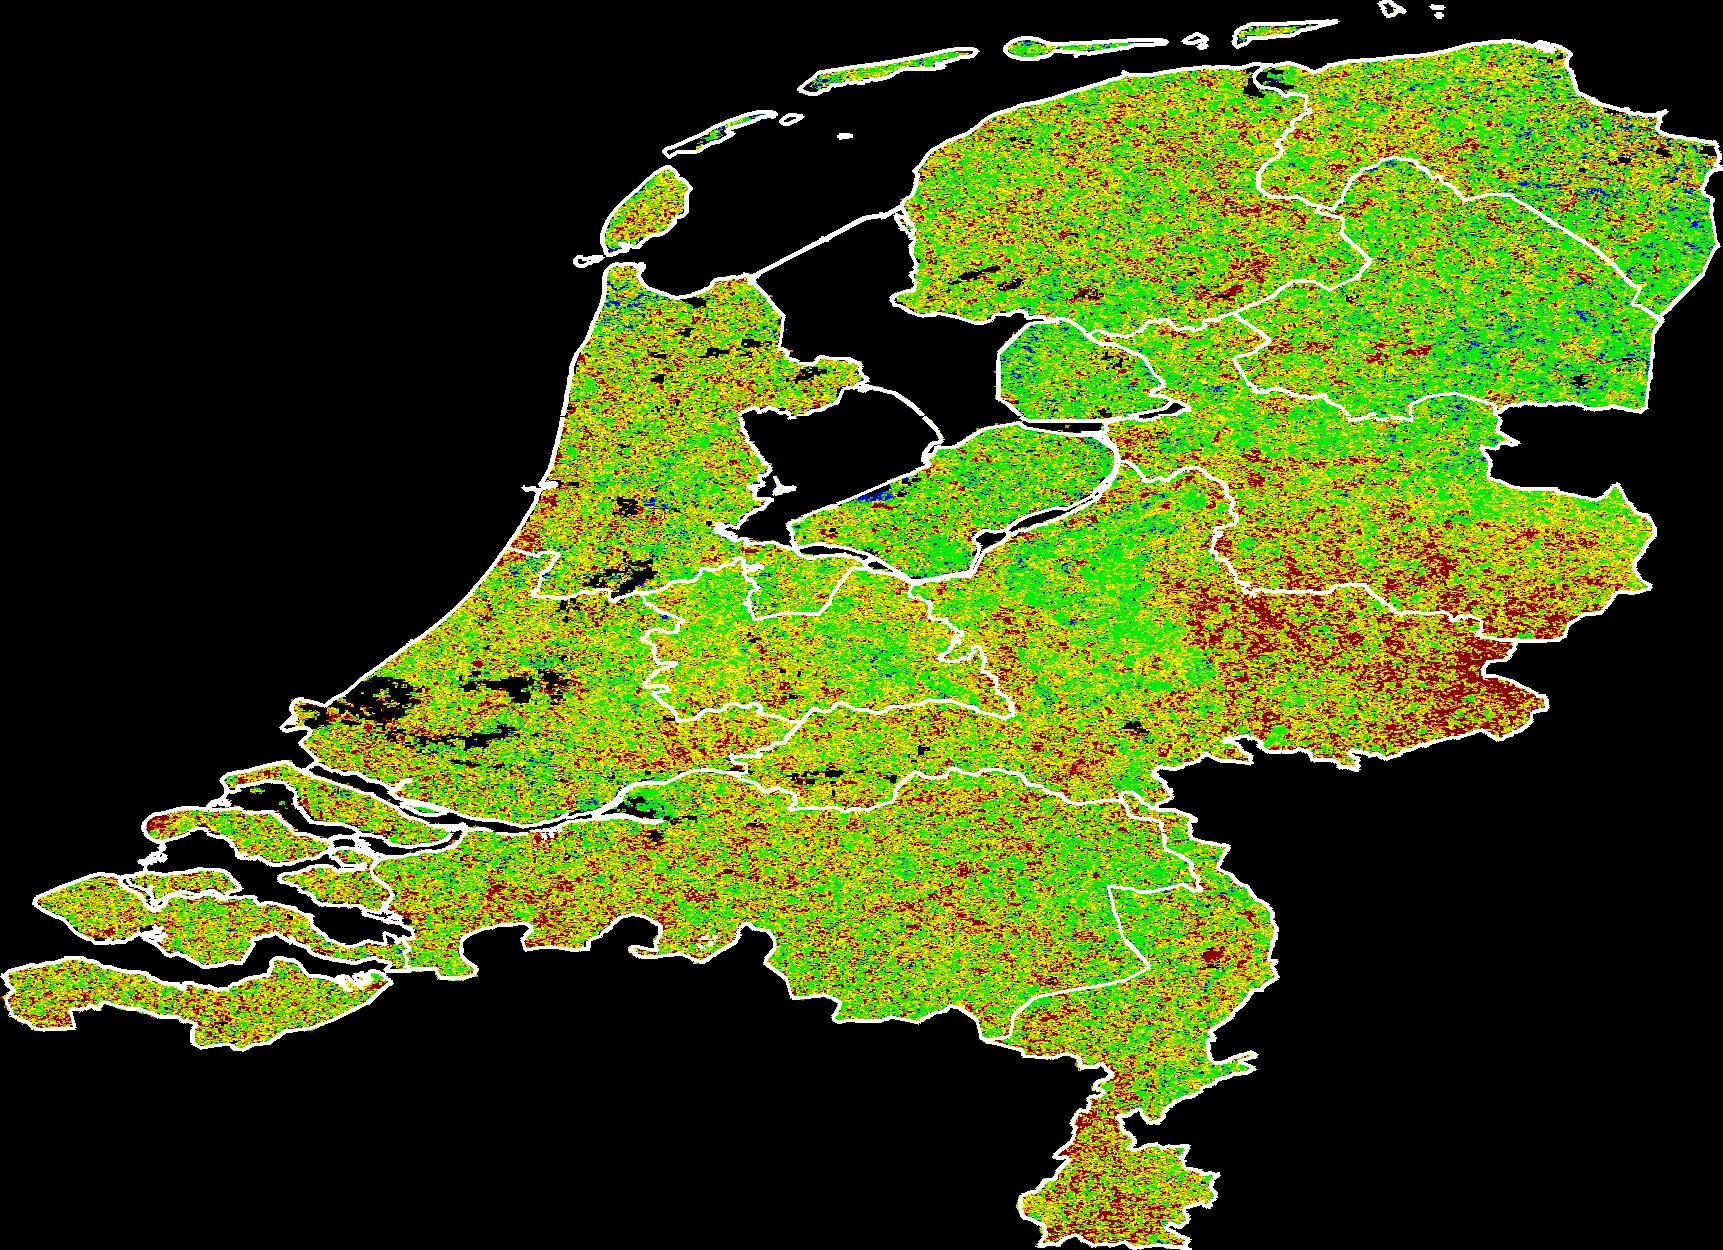
VCI index for 9 May to 24 May 2022 compared to the vegetation situation at the same time period between 2000 to 2016

VCI index for 10 June to 25 June 2022 compared to the vegetation situation at the same time period between 2000 to 2016
VCI index for 12 July to 27 July 2022 compared to the vegetation situation at the same time period between 2000 to 2016
VCI index for 28 July to 12 August 2022 compared to the vegetation situation at the same time period between 2000 to 2016
VCI index for 13 August to 28 August 2022 compared to the vegetation situation at the same time period between 2000 to 2016
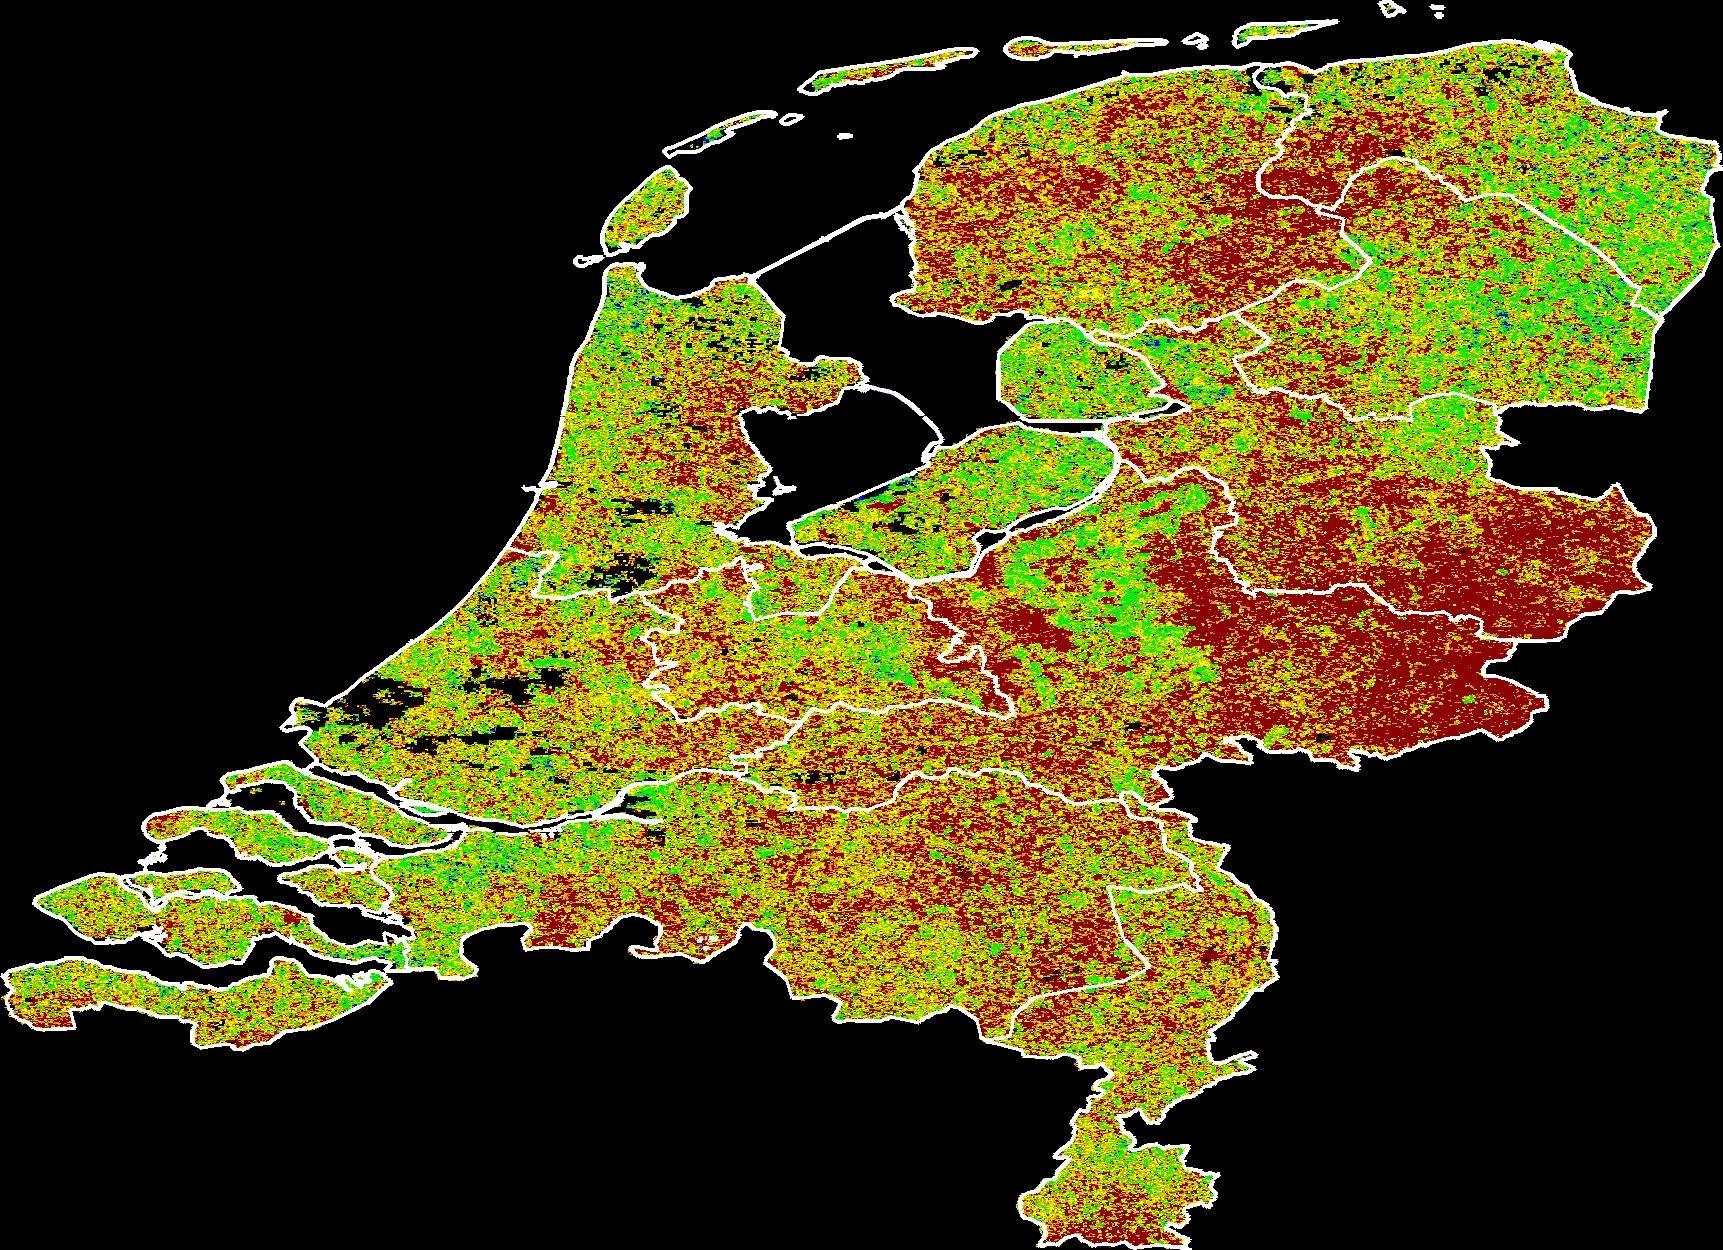
VCI index for 29 August to 13 September 2022 compared to the vegetation situation at the same time period between 2000 to 2016