
1.10 Concept of Remote Sensing Image Analysis
Written By Nanno Mulder, Ali Abkar, Ali Naeini
Remote Sensing (RS)
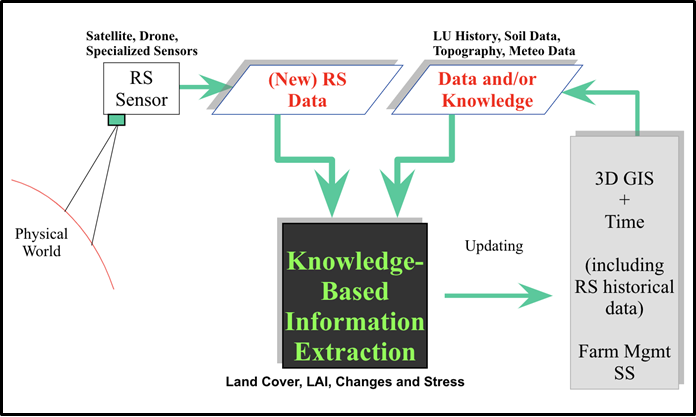
RS is the activity of generating data from non-contact physical measurements. Often the extraction of information from the data is included in the definition of the field of RS. In many cases, this extraction of information from RS data is called (image/photo/picture) interpretation. Images are taken from space, photographs are taken from the air (using drones) to study features and monitor natural and man-based processes that take place on the Earth's surface.
The Goal: support Decision Making
By building, Measurement and Control System Models (user-specific), of which image analysis is a major part.
How does Image Analysis support Decision Making?
by monitoring the system and support taking actions when needed
Our Methodology of image analysis.
Optimisation of the expected benefits of the provided information
Quality control includes critical selection of data and algorithms
Reporting uncertainties and error rates
How to do Image Analysis?
We monitor the system continuously for deviation from the expected state due to factors like environmental effects, hazards, etc.
for monitoring, a system model is required. Implemented as GIS & Process Models.
System Implementation
The current flow is “Data-driven, Big data gathering, measurement, and mapping!”
Our Approach: If needed (utility function), Knowledge-driven, prediction (effect of management action and/or stress), minimum data gathering, measurements, testing hypotheses, and mapping
Building System Models
1. The study area (user-defined location)
2. Crops (user-defined crops, location/coordinates, shape (rectangular, corner object), how many ha, topography, irrigation/drainage system, growth and health issues, adjacent objects)?
3. Period (User-defined)
4. Required (extra) info? required anomalies/risks? weather risks? rain? Prevention of disease before it gets too late?
5. Available Prior Knowledge! Please seriously look for the available expert knowledge.
6. (timely) Remote Sensing image analysis (Satellite, drones and specialized sensors) for Precision Agriculture on a Cost-Effective Basis
Multi-temporal, Multi-resolution, Multi-source satellite data (available at the time-location)
Drone Orthomosaics
Algorithms and Software for Knowledge-Based Image Analysis
Integration of expert knowledge in pattern recognition, image analysis and classification procedures
Summary on Building System Models: in this section “Information requirements” is defined.
Data Selection
Platforms :
Satellite
Aeroplane
Drone
Ground platforms
Sensor Type
Camera (RGB, RGBI)
Spectrometers
Imaging spectrometer
Thermal
RADAR
LIDAR
3D Camera
Costs and applications.
Drone
RGB
Hyperspectral
CoSpectroCam
Case Study of a Drought Monitoring System
Data acquisition, processing, feature extraction and classification
Hypothesis: Scan drought-affected areas of greatest risk and/or management action. What are the possible impact of Drought on a farm and what can/will a farm do in concrete terms (alternative solutions than the farmer solutions considering Benefits over Costs)?
Detect and classify areas with drought-affected anomalies (Needed).
Our experience under drought project so far:
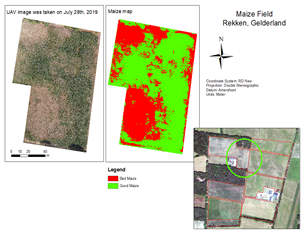
We combined different types of platforms and technologies, from satellites to Unmanned Aerial Vehicles (UAVs), for crop monitoring.
By utilizing computer-assisted analysis of satellite and drone data, along with the systematic use of knowledge from application domain experts, we are able to add value to the agri-food value chain.
Suggestions were given to Farmers towards improving the sandy soil quality [by adding loamy soil or compost to improve the moisture retention capacity of the soil during dry weather], which the farmer did some soil improvement, and it could also be linked to better production.
Comparison with other methods
The difference in expected costs and benefits is based on the best prior probabilities and based on the post (model+ data) probabilities x net-utility matrices.